AWS Distro for OpenTelemetry
Configuring ECS console To collect metrics and traces using ADOT
Configuring ECS console To collect metrics and traces using ADOT
This blog post discusses a technical solution for customers to be able to collect metrics and traces from their ECS console using the ADOT Collector under the hood and sending this observability data to the AWS monitoring destination service of their choice. AWS monitoring services in this case include Amazon Cloudwatch, Amazon Managed Services for Prometheus (AMP) and AWS X-Ray.
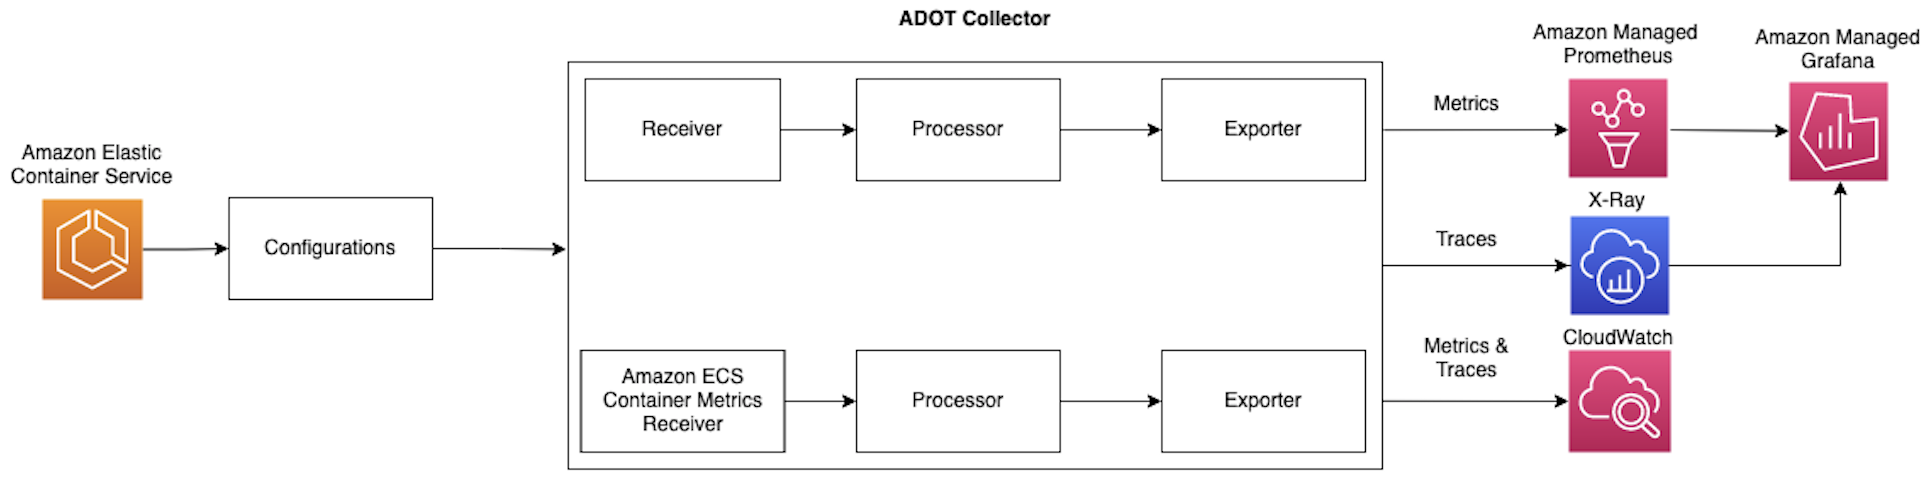
The end-to-end data path that we will be using can be seen in the diagram below where the user will be using the ECS console to configure the collection of observability data (metrics and traces in this case) and use the ADOT Collector to collect, process and export this data to the monitoring backend (AMP, Amazon Cloudwatch or AWS X-Ray).
Component Background
Here are some background information for the services that we will be utilizing throughout the entire process:
Amazon Elastic Container Service (Amazon ECS) is a highly scalable, fast container management service that makes it easy to run, stop, and manage containers on a cluster. Your containers are defined in a task definition that you use to run individual tasks or tasks within a service. In this context, a service is a configuration that enables you to run and maintain a specified number of tasks simultaneously in a cluster. You can run your tasks and services on a serverless infrastructure that is managed by AWS Fargate. Alternatively, for more control over your infrastructure, you can run your tasks and services on a cluster of Amazon EC2 instances that you manage.
AWS Distro for OpenTelemetry Collector (ADOT Collector) is a AWS supported version of the upstream OpenTelemetry Collector. It is fully compatible with AWS computing platforms including EC2, ECS and EKS. The OpenTelemetry Collector is a vendor-agnostic implementation to receive, process, and export telemetry data. Specifically, it enables users to send telemetry data to AWS CloudWatch Metrics, Traces and Logs backends as well as the other supported backends.
Amazon Managed Services for Prometheus (AMP) enables us to easily establish both monitoring and alerting services for container environments on EKS, ECS, Lambda, and many other AWS services. Specifically, AMP collects metrics in the form of time series data from containers & nodes and stores them.
Amazon Managed Grafana (AMG) is a highly scalable, highly available, and fully managed service for open source Grafana, providing interactive data visualization for your monitoring and operational data. Using Amazon Managed Grafana, you can visualize, analyze, and alarm on your metrics, logs, and traces collected from multiple data sources in your observability system, including AWS.
AWS X-Ray is a service that collects data about requests that your application serves, and provides tools that you can use to view, filter, and gain insights into that data to identify issues and opportunities for optimization. You can also use X-Ray to monitor application traces, including the performance of calls to other downstream components or services, in either cloud-hosted applications or from their own machines during development.
Amazon CloudWatch collects and processes raw data from Amazon ECS into readable, near real-time metrics. It receives time-series metrics and trace data in real time; our receiver generates data points and CloudWatch presents these data to data within the Amazon CloudWatch console. With CloudWatch, we able to display more data points for you to observe, one sample count in CloudWatch is actually the aggregate of multiple data points in one minute.
Getting Started
Here is a step-by-step set up guide to set up your ECS console and collection pipeline by selecting the type of observability data you want to collect and the monitoring service you want to send this data to.
Task Definition Setup
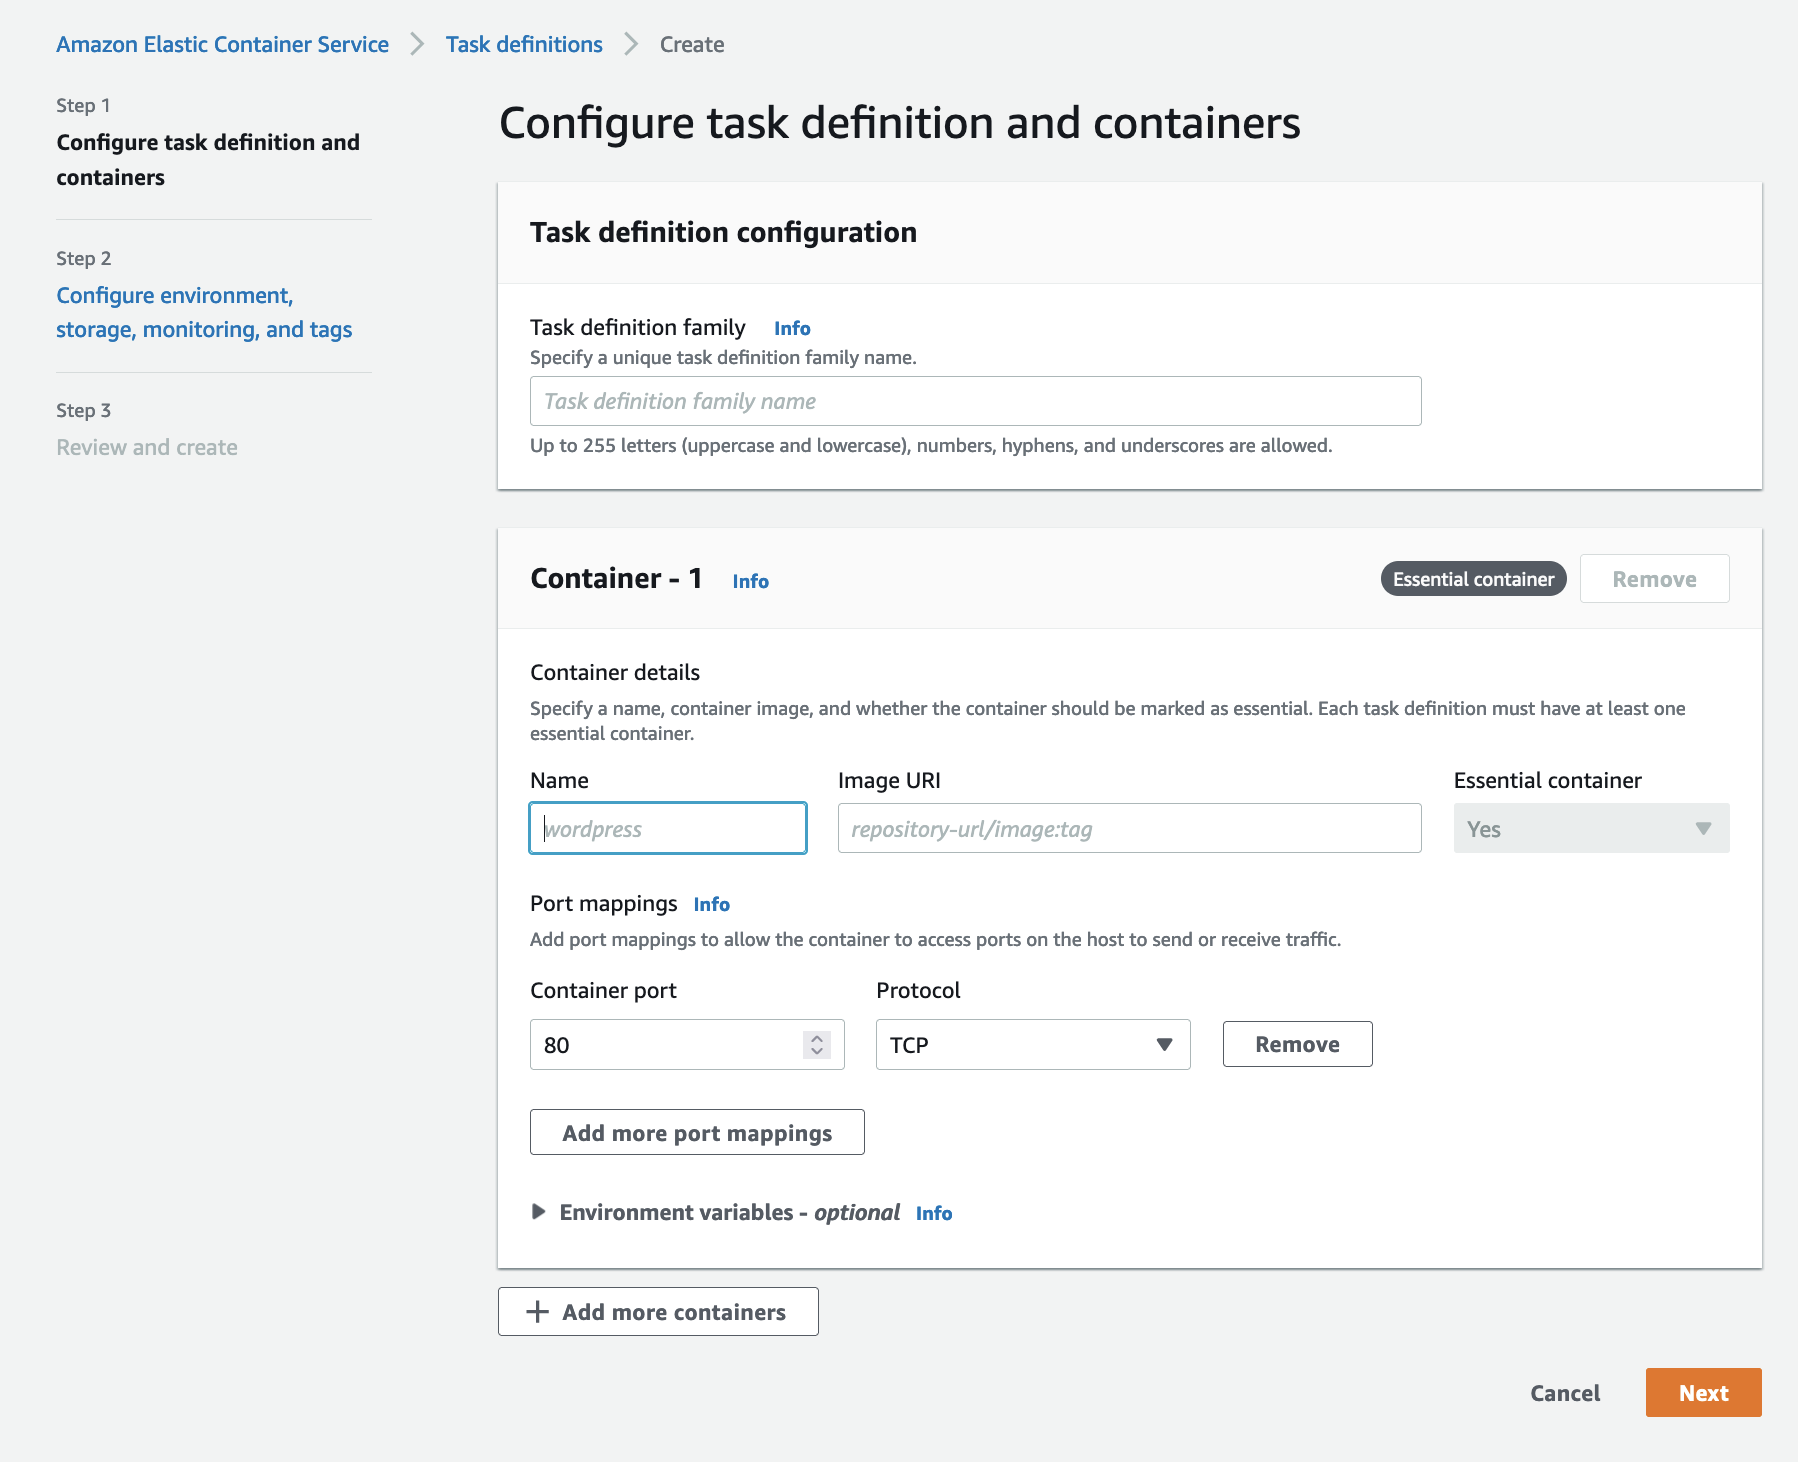
Step 1: In the first step of the new ECS V2 Console, you will be able to specify task definition family name, image URI if you would like to setup monitoring, container port mappings, and the necessary environment variables to setup your container‘s environment (sample application).
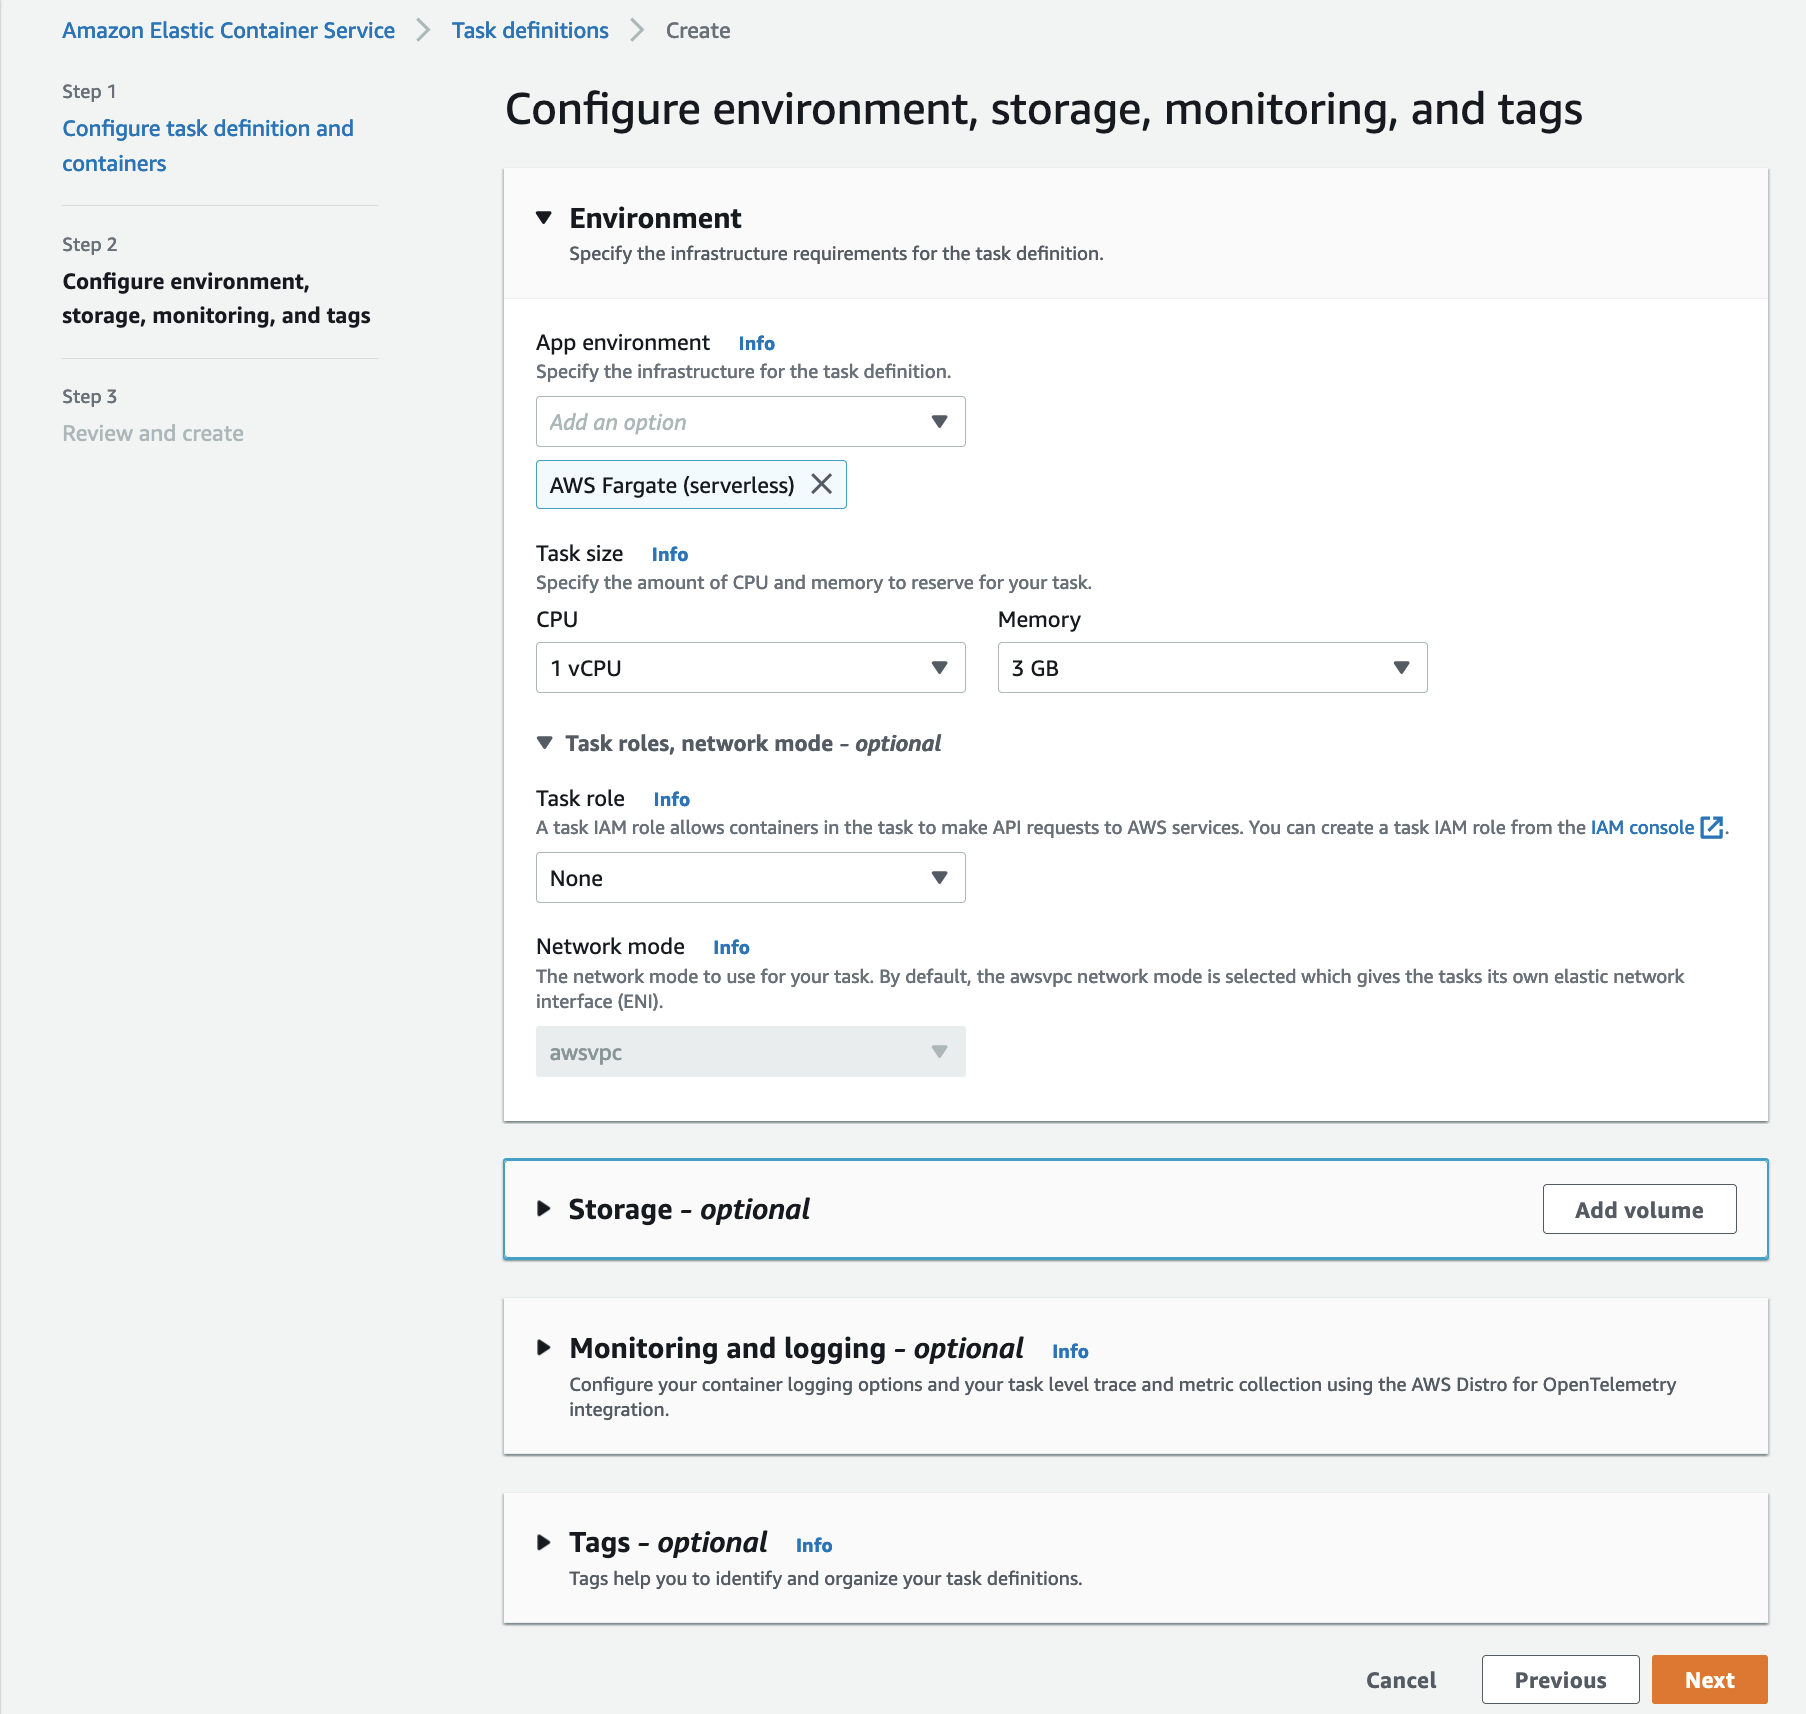
*sStep 2:** In the second step, you will need to set up the environment with the necessary settings such as app environment, task size, task role, and storage.
Note: Please make sure the Task role has the correct IAM policies created in the prerequisite section. These are the required permissions for Amazon CloudWatch for metrics, AWS X-Ray for traces, and for Amazon Managed Service For Prometheus to access and query data.
Step 3: In this part of the getting started guide, you can set up the configurations by utilizing the newly developed ECS console for streamlined deployments of all of the above configurations.
After configuring the environment, you will have the option to select Monitoring and Logging in the UI below. In this section, Monitoring and Logging, you will be able to select configurations for log collection, metric collection or trace collection here.
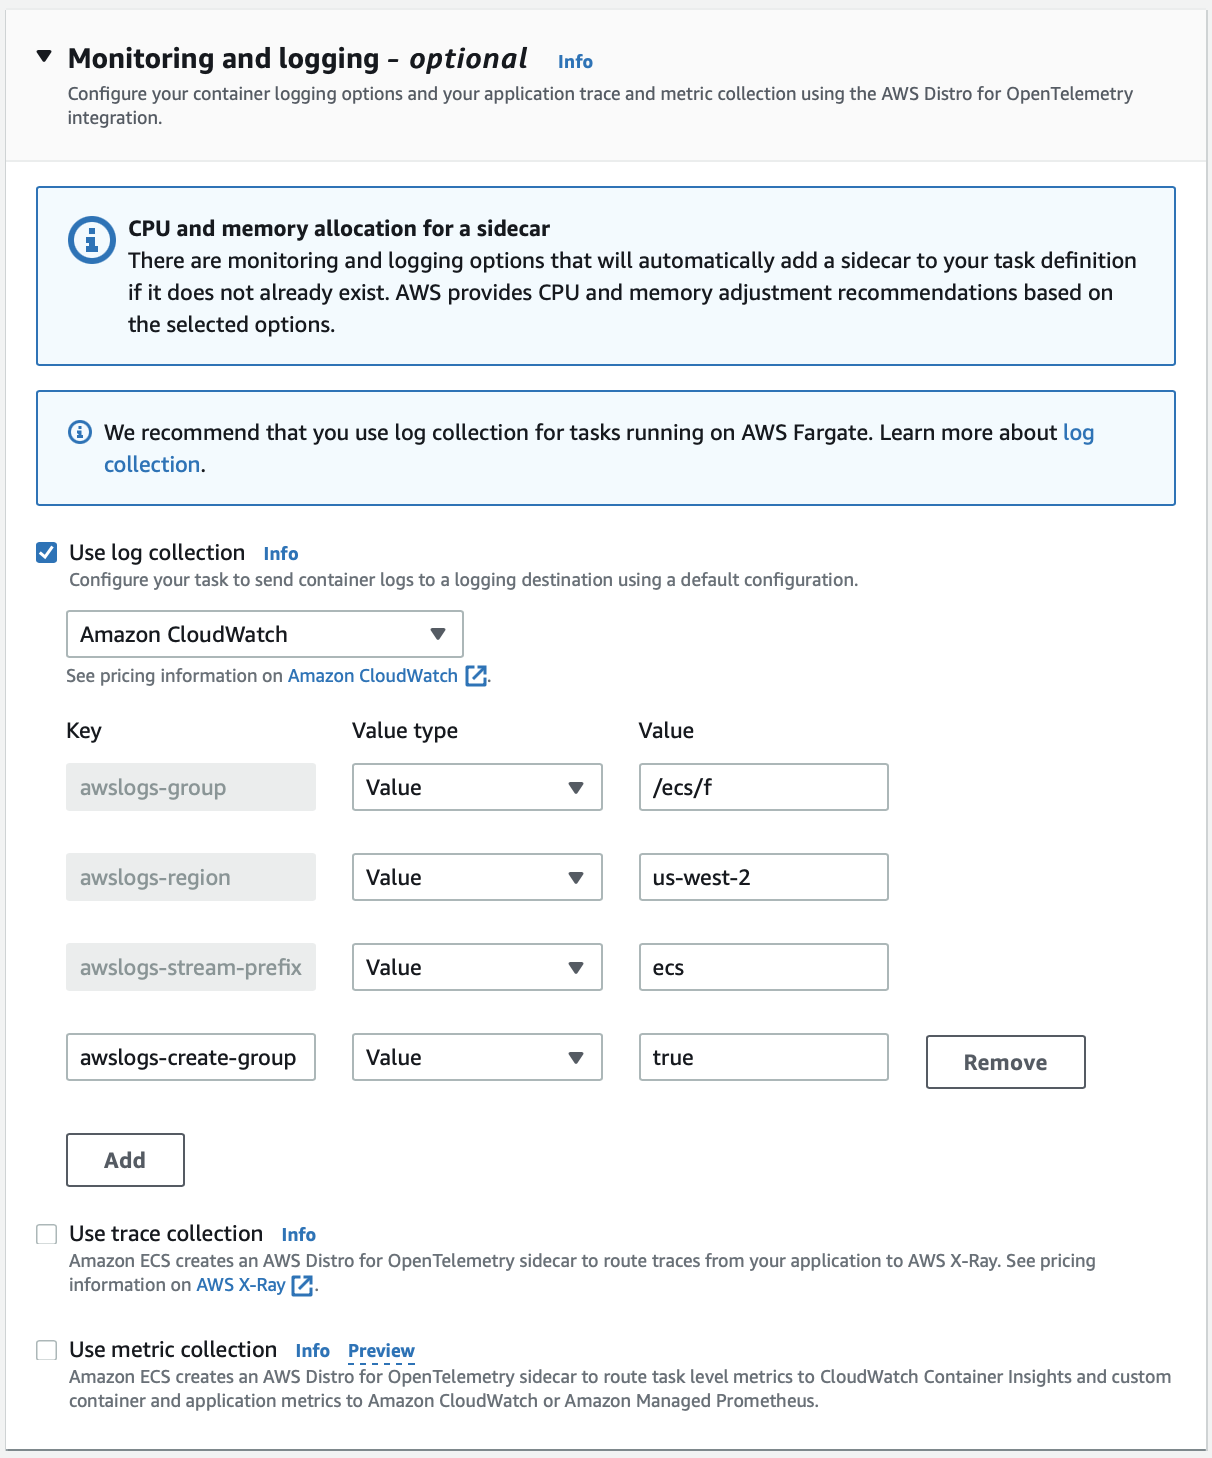
In the next screen, you can select the log collection parameters and criteria to which log collection service to utilize. You can also specify the criteria for collection of trace data to AWS X-Ray and utilize the AWS X-Ray console to observe traces. In the metric collection section, you can select the destination to send your metric metadata to Amazon CloudWatch or Amazon Managed Service for Prometheus (AMP) by specifying the AMP endpoint.
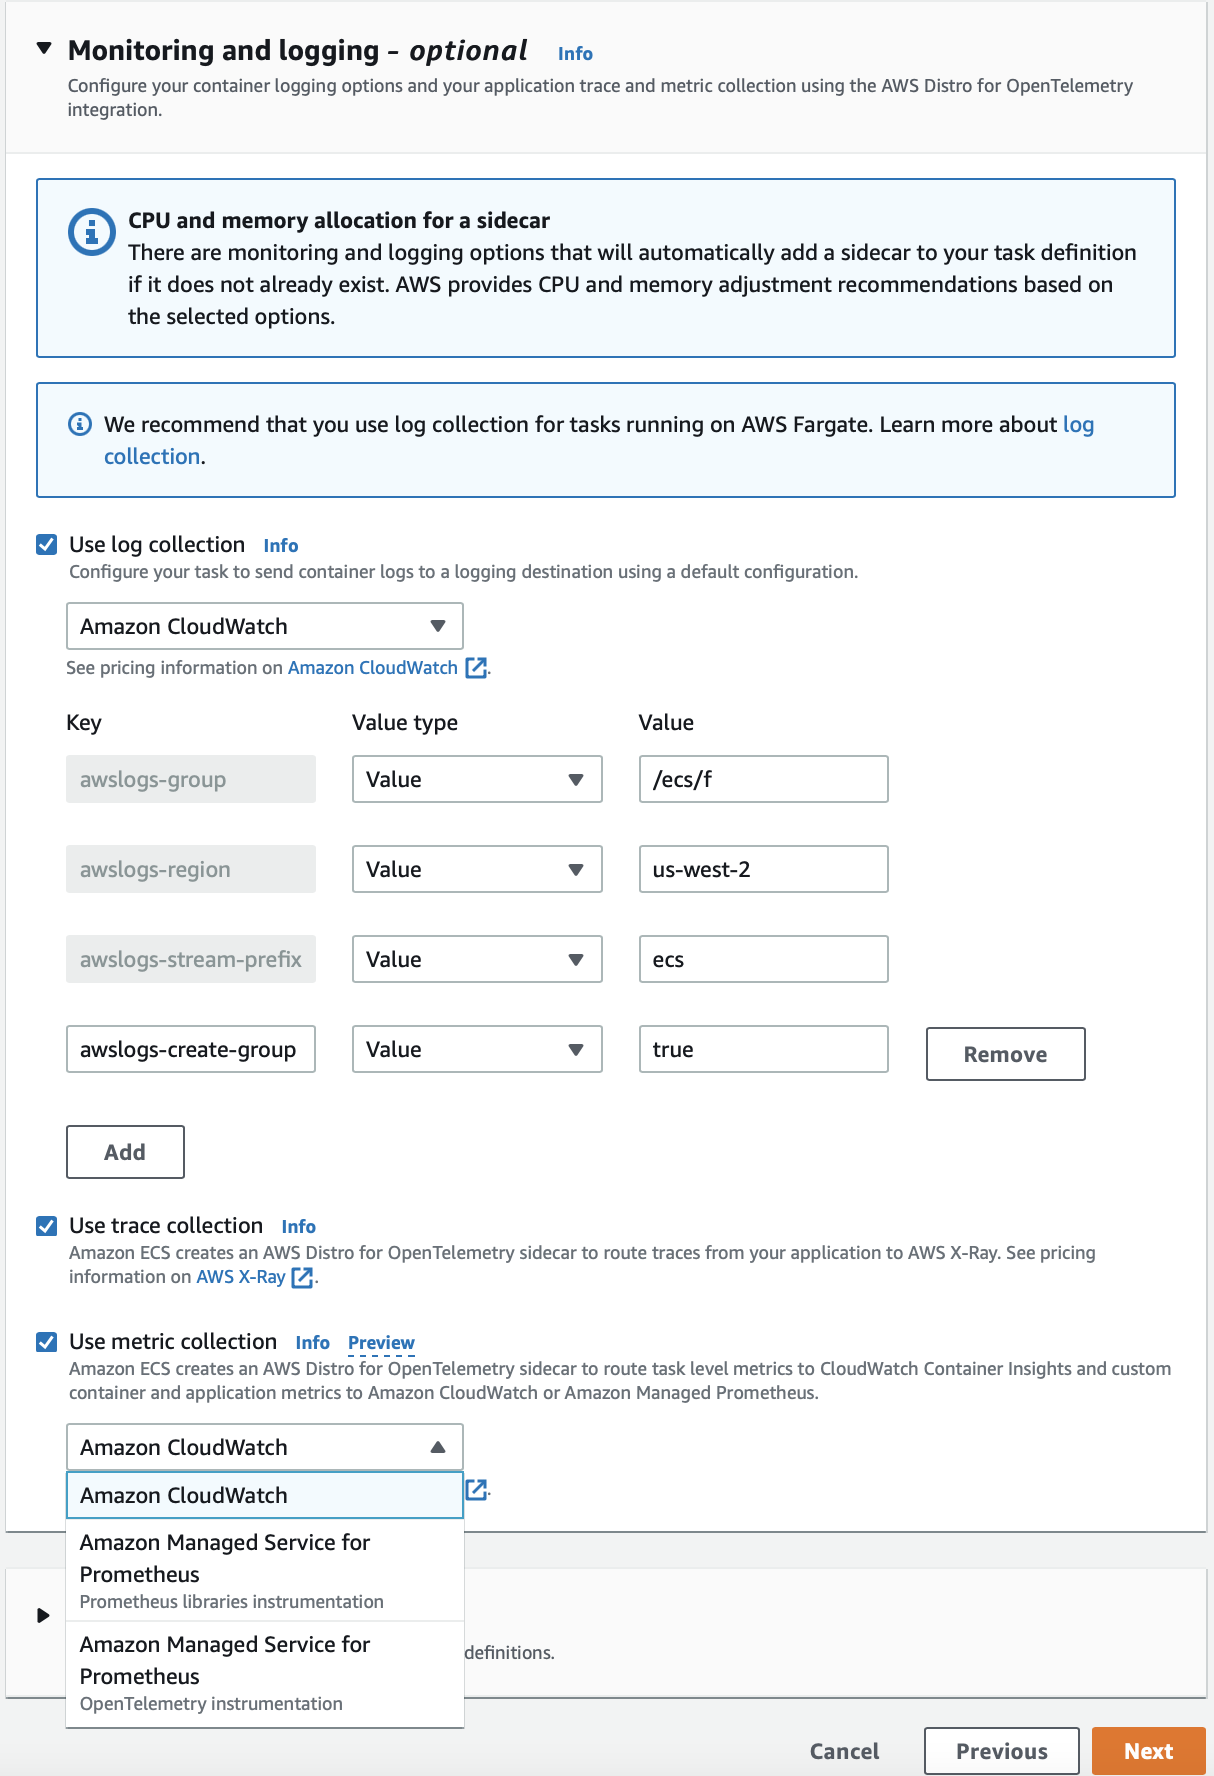
Note: Before utilizing Amazon Managed Service for Prometheus, we must create a Amazon Managed Service for Prometheus workspace so we can obtain the endpoint to send the data to Prometheus. Follow this guide to set up Amazon Managed Service for Prometheus and input the Endpoint - remote write URL into the Amazon Managed Service for Prometheus endpoint section of metric collection. One option to viewing your application metrics from Prometheus is utilizing Amazon Grafana which can be setup by following this guide.
Here are the five different use cases that you can collect metrics and traces using the ECS console.
- AMP Only
- CloudWatch Only
- X-Ray Only
- CloudWatch-X-Ray
- AMP-XRay
Understanding your configuration
After specifying your observability data signals and monitoring destinations to send traces and metrics from ECS, here is the list of metric types and trace types that you can collect.
| ECS Console Observability data type selection | Destination Monitoring Service | Observability data type | ADOT Configuration |
|---|---|---|---|
| Traces | X-Ray | Traces: data generated by the individual services and resources that make up your application, end to end path for request made to application | ecs-xray.yaml |
| Traces and Metrics | X-Ray and CloudWatch | Traces: data generated by the individual services and resources that make up your application, end to end path for request made to application Metrics : MemoryReservation CPUUtilization CPUReservation MemoryUtilization NetworkRxBytes NetworkTxBytes StorageReadBytes StorageWriteBytes | ecs-cloudwatch-xray.yaml |
| Traces and Metrics | X-Ray and AMP | Traces: data generated by the individual services and resources that make up your application, end to end path for request made to application Metrics : ecs.task.memory.reserved ecs.task.memory.utilized ecs.task.cpu.reserved ecs.task.cpu.utilized ecs.task.network.rate.rx ecs.task.network.rate.tx ecs.task.storage.read_bytes ecs.task.storage.write_bytes container.duration | ecs-amp-xray.yaml |
| Metrics | CloudWatch | MemoryReservation CPUUtilization CPUReservation MemoryUtilization NetworkRxBytes NetworkTxBytes StorageReadBytes StorageWriteBytes | ecs-cloudwatch.yaml |
| Metrics | AMP | ecs.task.memory.reserved ecs.task.memory.utilized ecs.task.cpu.reserved ecs.task.cpu.utilized ecs.task.network.rate.rx ecs.task.network.rate.tx ecs.task.storage.read_bytes ecs.task.storage.write_bytes container.duration | ecs-amp.yaml |
Testing Plan
In the testing plan, we tested and verified each configuration of the aws-otel-collector. We will utilize the java-sample-app receiver and Prometheus Remote-Write Exporter. The java-sample-app receiver produces mock OTLP data which is processed and then the exporter receives this data in the pipeline. The exporter transforms incoming metrics into a Prometheus Remote Write API compatible format. We are able to view these datapoints through Amazon CloudWatch, Amazon X-Ray, and Amazon Managed Service For Grafana(AMG). We utilized these AWS technologies to verify whether each configuration outputs the accurate metrics and trace data.
An example test case that we went through was the ecs-amp.yaml configuration where we utilized Amazon Managed Service For Grafana to visualize the metrics shown below.
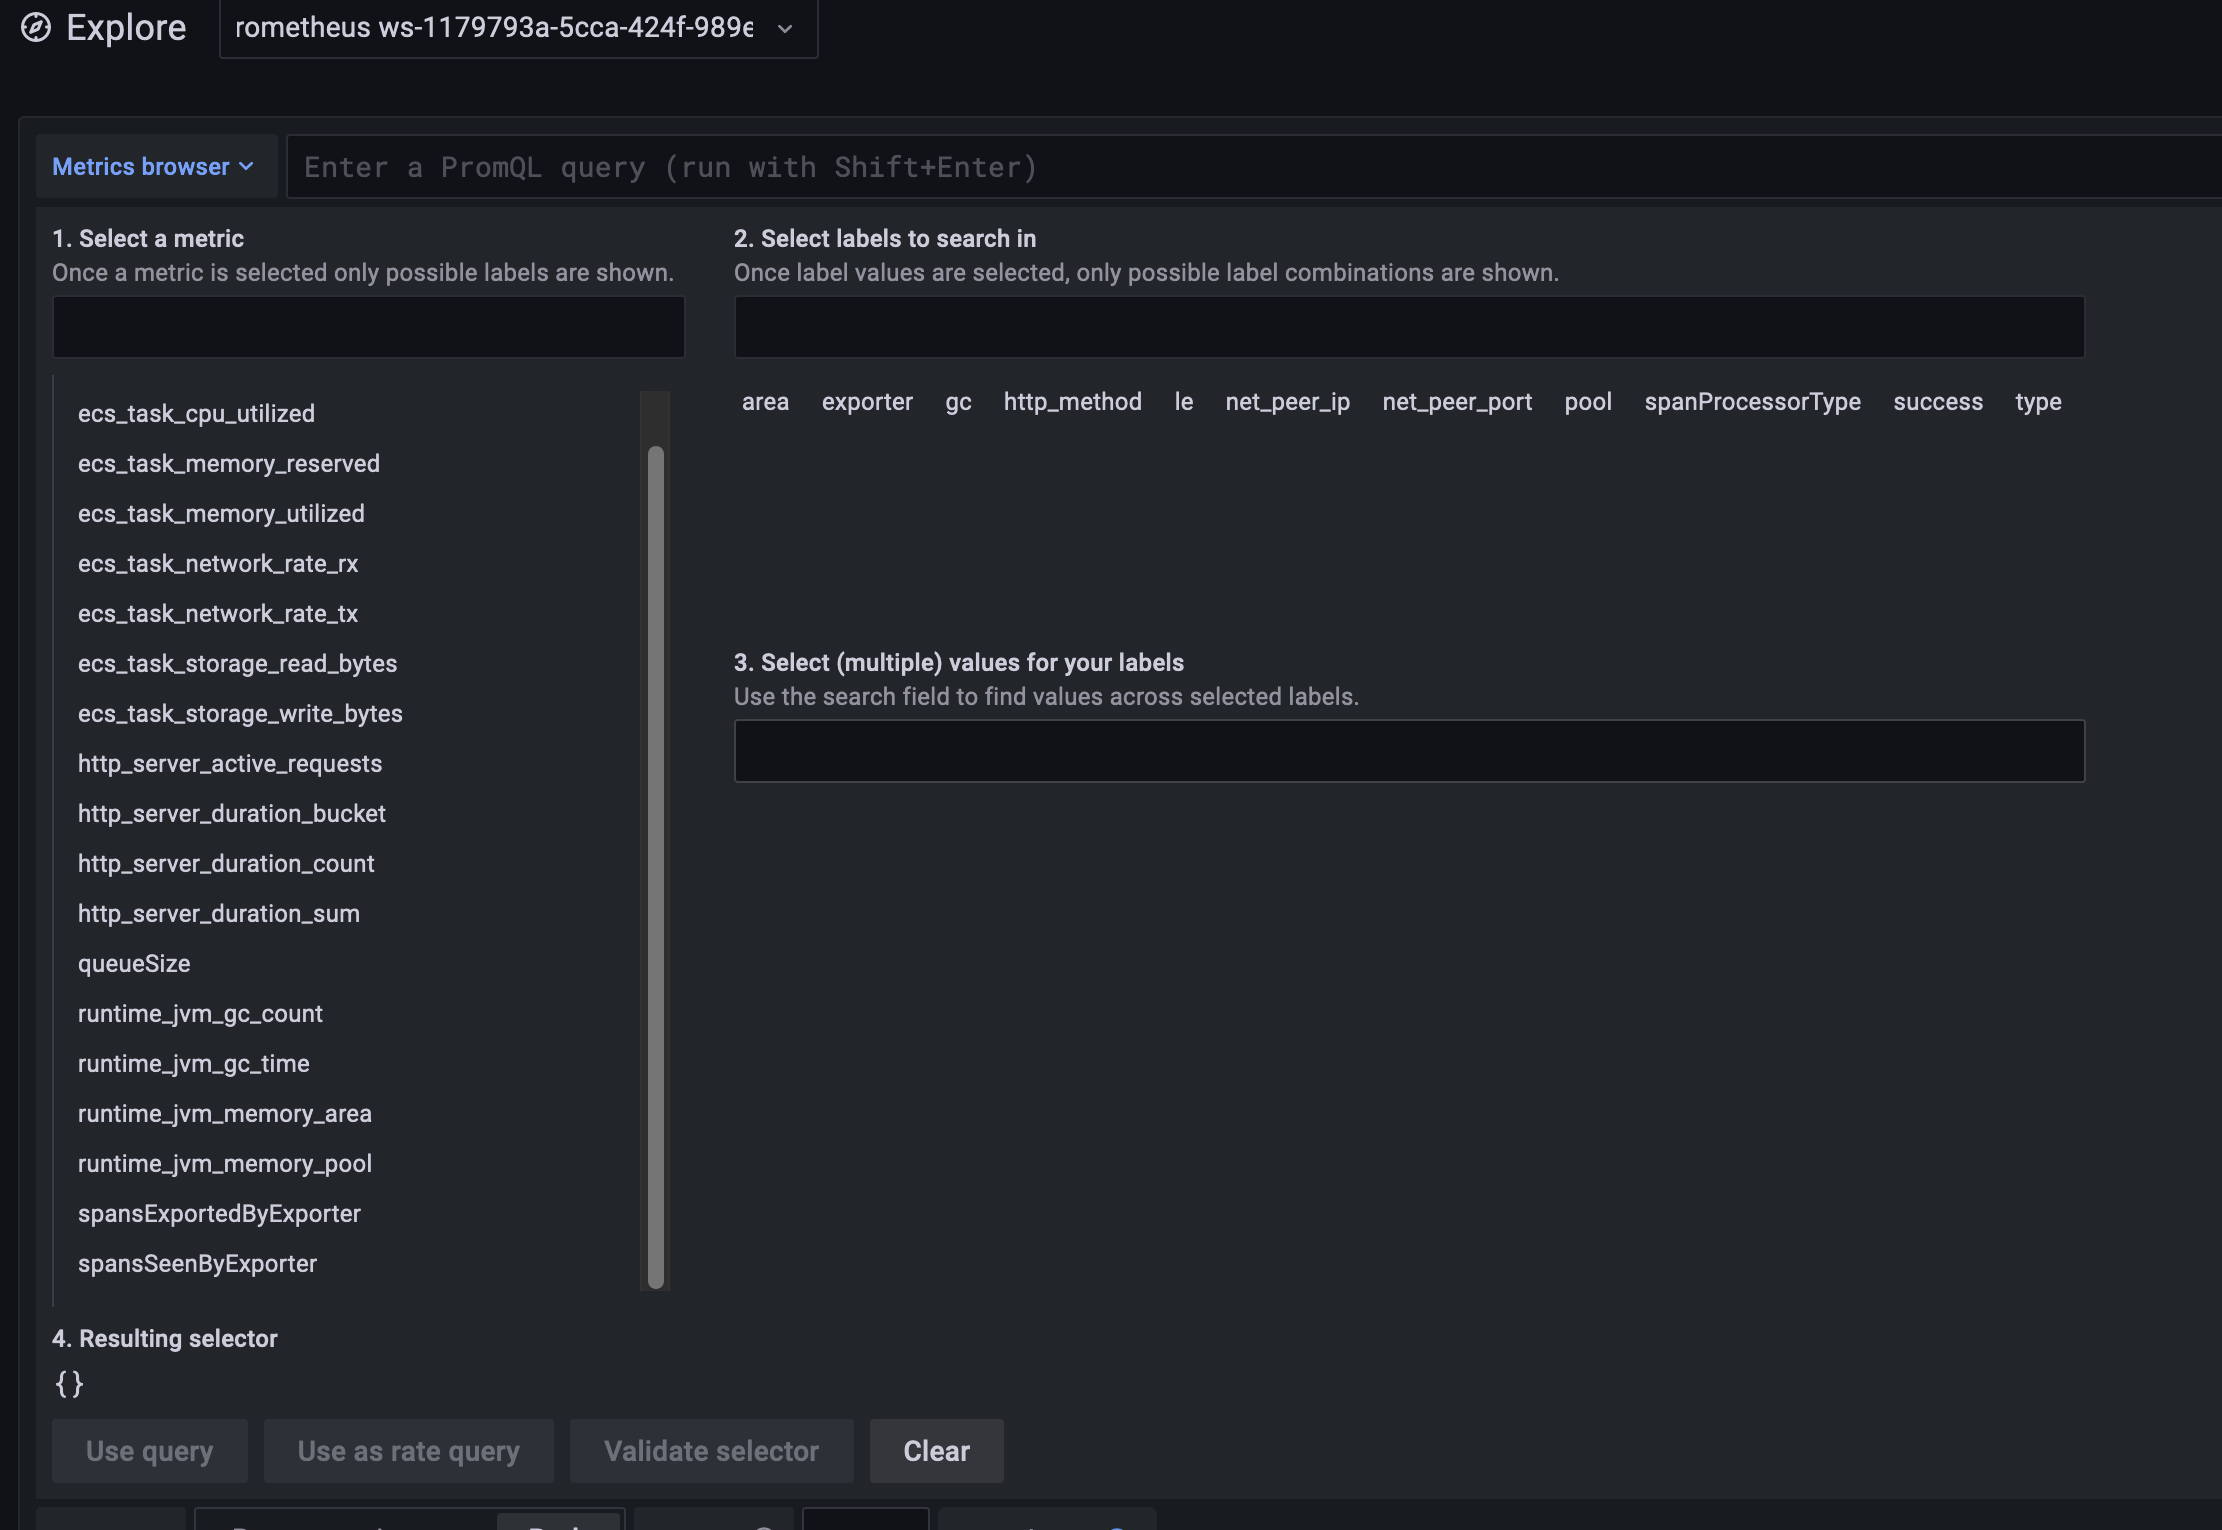
Here are the list of application metrics that we received while using java-sample-app as receiver.
| Metrics | Definition |
|---|---|
| http_server_active_requests | HTTP requests are messages sent by the client to initiate an action on the server |
| http_server_duration_count | The average amount of time it takes for a queried metric to deliver |
| queuesize | Size of HTTP queue requests that provides time for new connections to become available on the server |
| runtime_jvm_gc_count | Java virtual machine runtime metrics |
| runtime_jvm_gc_time | Java virtual machine runtime metrics |
| runtime_jvm_memory_area | Java virtual machine runtime metrics |
| runtime_jvm_memory_pool | Java virtual machine runtime metrics |
| spansExportedByExporter | Number of spans that are exported by the exporter |
| spansSeenByExporter | Number of spans that are seen by the exporter |
In this example above, we confirmed that all metrics are received correctly from Amazon Managed Prometheus utilizing the ecs-amp.yaml configuration.
Difficulties
While developing and setting up these configurations, we ran into configuring difficulties with utilizing both (Amazon EC2 + AWSVPC network mode). This combination does not allow for you to have a public IP address which means that we do not have a NAT gateway setup to access the AWS APIS for post and get requests (no access to AMP/AMG). Specifically, for tasks hosted on EC2 instances, the AWSVPC network mode doesn’t provide tasks ENIs with public IP Addresses. A workaround solution to this issue would be to utilize AWS Fargate where you can just use a public subnet and give your containers a public IP address with a VPC so it can use the internet gateway to access external services.
Conclusion
Throughout the course of this project, we have learned so much about Amazon Web Services and observability. The ECS console makes it easy and convenient for the user to configure and collect observability data to send to Amazon CloudWatch, AMP and AWS X-Ray. To learn more about how to use AWS Distro for OpenTelemetry (ADOT) to collect data for your observability solution, check out the hands-on AWS Observability workshop. You can also find detailed ADOT technical documentation here. Please file an issue if you have questions or request for enhancements in the ADOT distribution, features, or components.
Authors

Pavan Sai Vasireddy is a recent graduate working as a Software Development Engineer on the AWS Observability team. He is passionate about monitoring and observability, currently focussed on release engineering for ADOT collector, building monitoring tools and contributing to open source.

Richard To is a Software Development Engineer Intern on the AWS Observability team and is interested in observability and infrastructure.