AWS Distro for OpenTelemetry
Getting Started with AWS Distro for OpenTelemetry using EKS Add-Ons
Getting Started with AWS Distro for OpenTelemetry using EKS Add-Ons
Table of Contents
Introduction
Requirements
Installation
Add-on Advanced Configuration
Collector Configuration Introduction
Injecting Auto-instrumentation
Kubernetes Attributes Processor
Target Allocator
Update and Cleanup
Troubleshooting
Introduction
Welcome to the getting started guide for AWS Distro for OpenTelemetry (ADOT) using Elastic Kubernetes Service (EKS) add-ons. This guide shows you how to leverage Amazon EKS add-ons to install and manage ADOT within your Amazon EKS cluster. ADOT is generally available (GA) for tracing and can also be used for metrics. Amazon EKS add-ons support for ADOT enables a simplified experience through EKS APIs to install one component of ADOT, the ADOT Operator, in your Amazon EKS cluster for your metrics and/or trace collection pipeline. Amazon EKS add-ons support reduces the amount of configuration, setup, and deployment that would be required otherwise. For more information, see Amazon EKS add-ons.
This guide contains:
- Requirements to install ADOT
- How to install the ADOT using Amazon EKS add-ons.
- How to set up the ADOT Operator and Collector.
- How to instrument your applications on Amazon EKS.
- How to configure the ADOT Collector to collect, and send infrastructure and application metrics from Amazon EKS clusters and applications to either Amazon Managed Service for Prometheus or CloudWatch.
- How to configure an ADOT Collector to collect and send application traces from workloads running on Amazon EKS to AWS X-Ray.
- How to update the ADOT EKS add-on
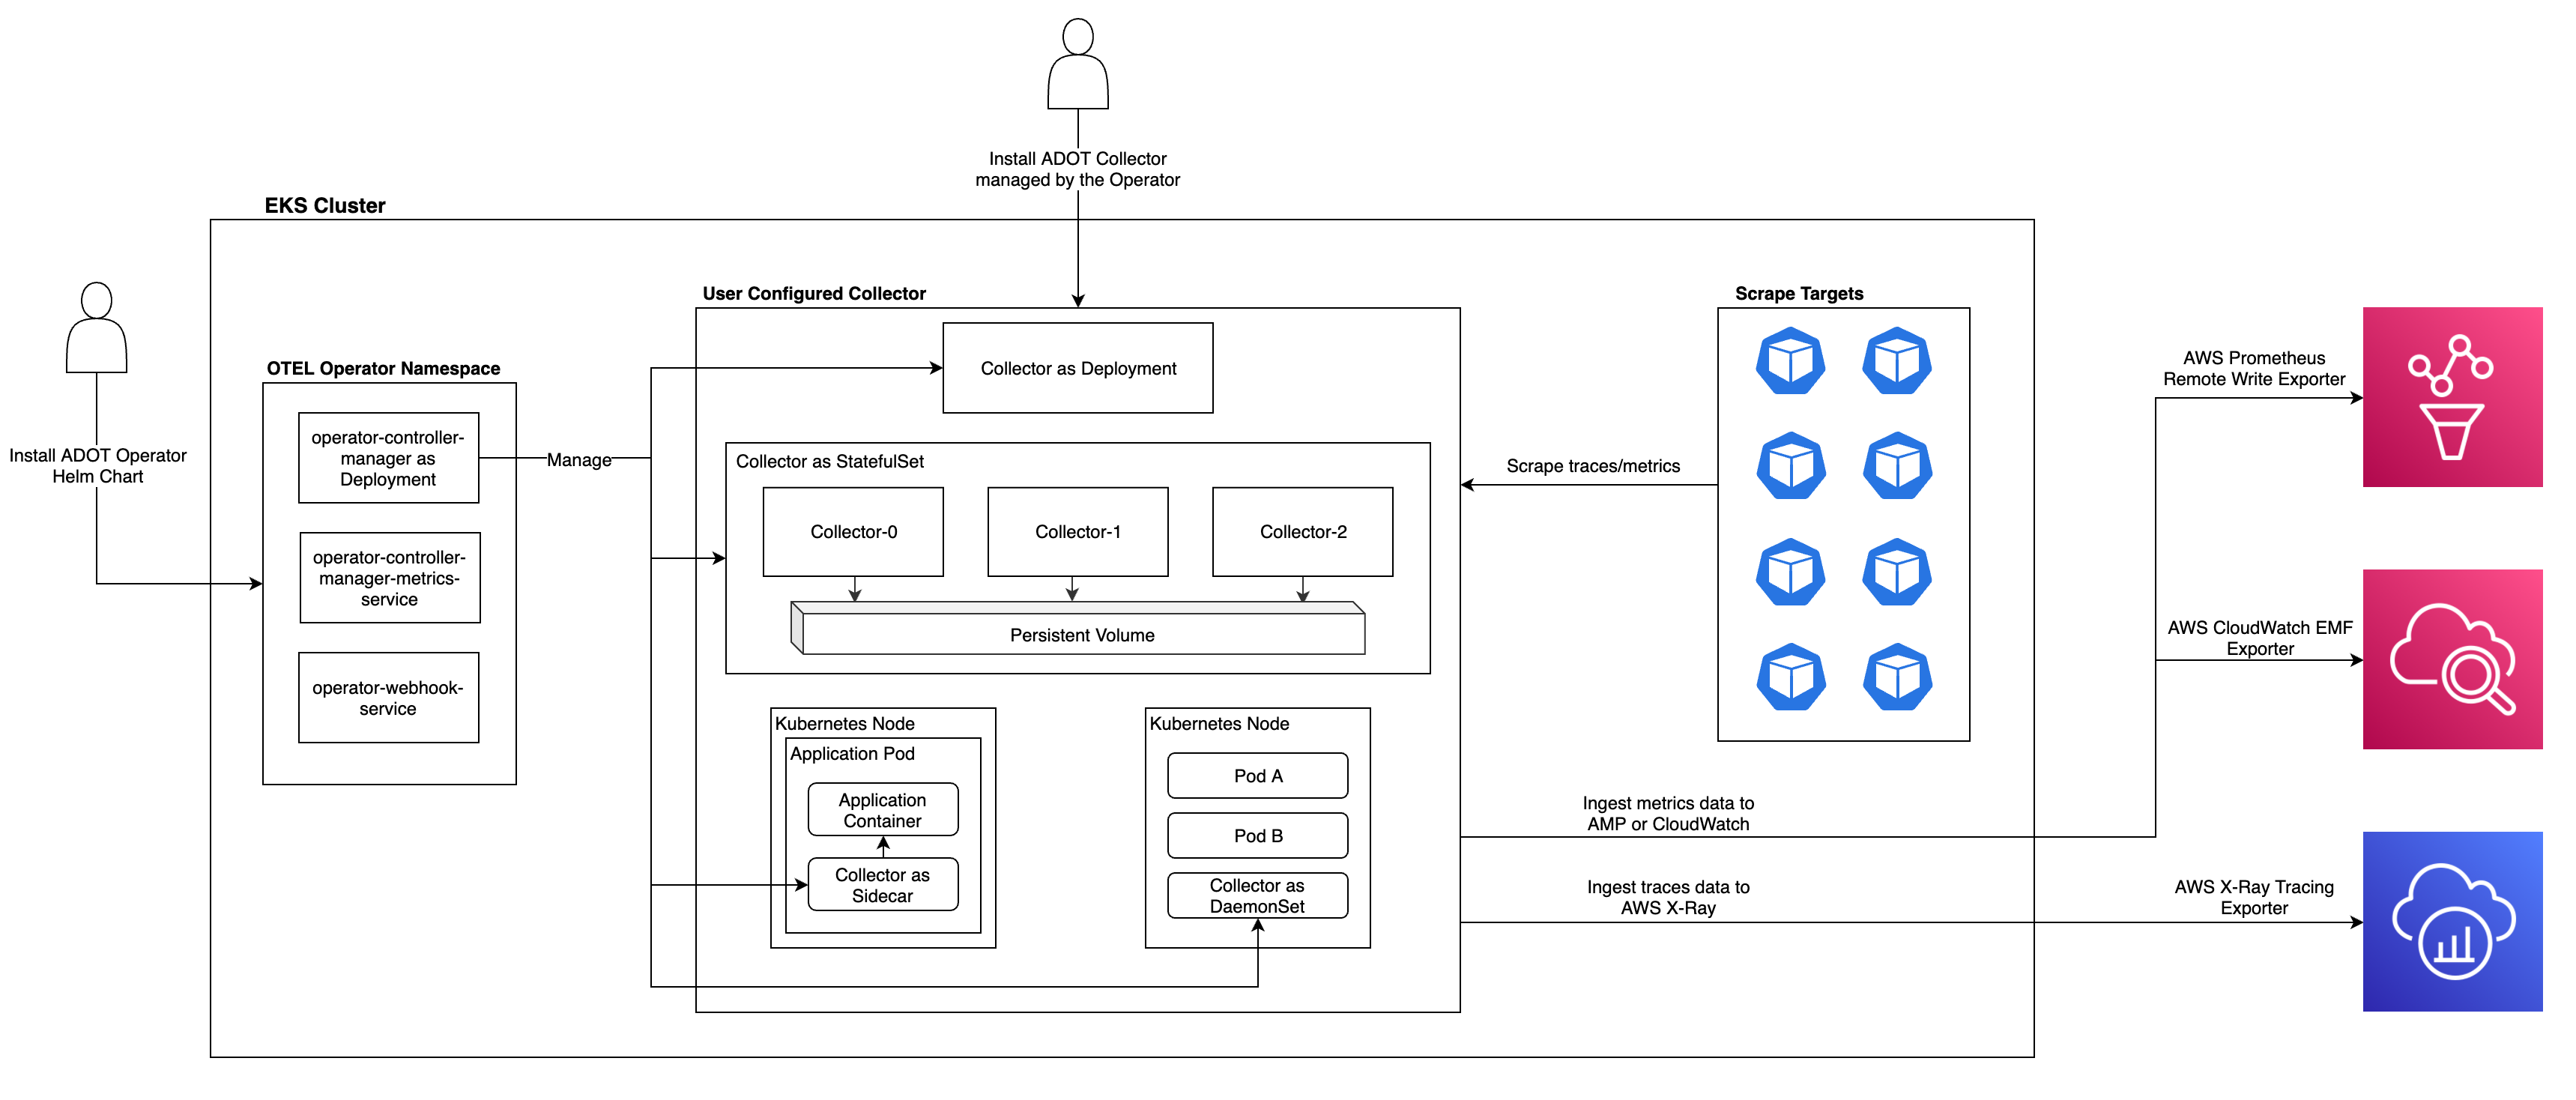
This diagram shows an end-to-end pipeline utilizing the ADOT EKS add-on. It breaks down the different components of the pipeline, as well as splits it up into three smaller pipelines; those three pipelines are configured for:
- Discovering and collecting Prometheus metrics and sending to Amazon Managed Service for Prometheus (AMP)
- Receiving OTLP metrics, and sending to Amazon Managed Service for Prometheus (AMP) and Amazon CloudWatch
- Receiving distributed application traces, and sending them to AWS X-Ray

Diagram: EKS ADOT Operator end to end pipeline
The ADOT Operator and ADOT Collector
When you leverage EKS add-ons, EKS will install the ADOT Operator. The ADOT Operator is an implementation of a Kubernetes Operator, a method of packaging and deploying a Kubernetes-native application and managed using Kubernetes APIs. In this case, the application is the ADOT Collector, which is a collection agent that receives, processes, and exports telemetry data in multiple data formats to multiple open source and vendor-service backends. A Kubernetes Operator is a custom controller, which uses a Custom Resource Definition (CRD) to simplify the deployment and configuration of Custom Resources (CR). The ADOT Operator introduces a new CR called the OpenTelemetryCollector through a CRD.
The ADOT Operator detects the presence of or changes for the OpenTelemetryCollector resource. For any such change, the ADOT Operator performs the following actions:
- Verifies that all the required connections for these creation, update, or deletion requests to the Kubernetes API server are available.
- Deploys ADOT Collector instances in the way the user expressed in the
OpenTelemetryCollectorresource configuration.
The diagram below shows how the Collector CR request flows from the customer to the ADOT Operator to deploy the ADOT Collector.

You can leverage EKS add-ons to maintain the ADOT Operator. The ADOT Collector is released and supported through regular ADOT releases on Amazon Elastic Container Registry (Amazon ECR) public gallery. If you want to update your ADOT Collector version to the latest release, apply a new configuration via CRD with an updated image. You can ask questions and report bugs on GitHub.
See this section to update these components.