AWS Distro for OpenTelemetry
Getting Started with Prometheus Remote Write Exporter for AMP
Getting Started with Prometheus Remote Write Exporter for AMP
In order to scrape and export metrics to your AWS Managed Service for Prometheus (AMP) instance, you can use either the AWS Distro for the OpenTelemetry Collector (ADOT Collector) or a standard vanilla Prometheus server.
In this Getting Started guide, we’ll show you how to configure the ADOT Collector to scrape from a Prometheus-instrumented application, and send metrics to the AWS Managed Service for Prometheus (AMP).
Before you Begin
The ADOT-AMP pipeline enables us to use the ADOT Collector to scrape a Prometheus-instrumented application, and send the scraped metrics to AWS Managed Service for Prometheus (AMP).
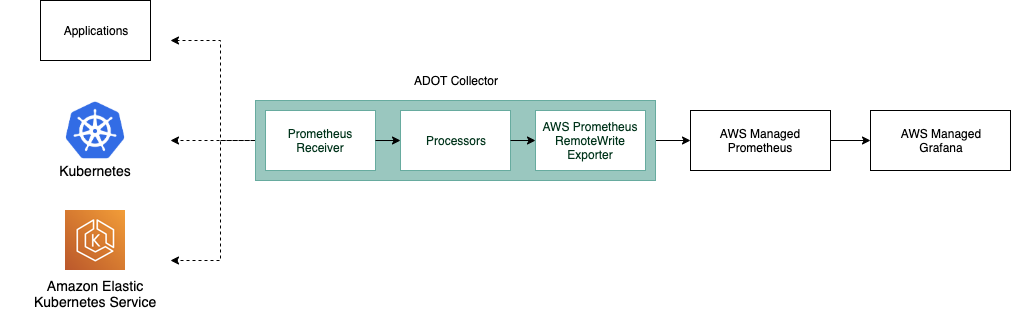
The ADOT-AMP pipeline includes two OpenTelemetry Collector components specific to Prometheus — the Prometheus Receiver and the Prometheus Remote Write Exporter.
Setup Guides for Different Environments
Components in our Pipeline
Prometheus Receiver
The Prometheus Receiver supports the full set of Prometheus scraping and re-labeling configurations described here. You should be able to directly paste in these configurations into your ADOT Collector configurations.
The configuration for the Prometheus Receiver will include your service discovery, scraping configurations, and re-labeling configurations. The receiver configurations will look like this:
1receivers:2 prometheus:3 config:4 [Your Prometheus configurations]An example configuration is shown below.
1receivers:2 prometheus:3 config:4 global:5 scrape_interval: 1m6 scrape_timeout: 10s7 8 scrape_configs:9 - job_name: kubernetes-service-endpoints10 sample_limit: 1000011 kubernetes_sd_configs:12 - role: endpointsNote: To perform Kubernetes service discovery, you will need to set up the proper permissions and RBAC authorization for the service account (to allow it to access the Kubernetes API). Please refer to the Permissions section in the advanced configurations doc.
Note: If you have existing Prometheus configurations, you will need to replace the $ characters with $$ to avoid having the value replaced with environment variables.
This is especially important for the replacement value of the relabel_configurations. For instance, the following configuration for relabel_configurations below
relabel_configs:- source_labels: [__meta_kubernetes_ingress_scheme,__address__,__meta_kubernetes_ingress_path] regex: (.+);(.+);(.+) replacement: ${1}://${2}${3} target_label: __param_targetwould become
relabel_configs:- source_labels: [__meta_kubernetes_ingress_scheme,__address__,__meta_kubernetes_ingress_path] regex: (.+);(.+);(.+) replacement: $${1}://${2}${3} target_label: __param_targetPrometheus Remote Write Exporter
The configuration for the Prometheus Remote Write Exporter is a lot simpler than the Prometheus receiver. At this stage in the pipeline, metrics have already been ingested, and we’re ready to export this data to AMP. The minimum requirement for a successful configuration to communicate with AMP is as follows:
1extensions:2 sigv4auth:3 service: "aps"4 region: "user-region"5
6exporters:7 prometheusremotewrite:8 endpoint: "https://aws-managed-prometheus-endpoint/v1/api/remote_write"9 auth:10 authenticator: sigv4authThis configuration sends an HTTPS request that is signed by AWS SigV4 using the credentials that are set up from the prerequisites section.
This is enabled by using the sigv4auth extension. It is mandatory that customers specify the service to be “aps”.
Regardless of the method of deployment, the ADOT Collector must have access to one of the listed options in the
default AWS credentials chain. The sigv4auth
extension depends on the AWS Go SDK and uses it to fetch credentials and authenticate. You must ensure that these credentials have remote writing
permissions to AMP (aps:RemoteWrite).
Name normalization
Starting with ADOT collector v0.35.0, this component will normalize metric names to follow Prometheus metric naming best practices. You can control this behavior
through the parameter add_metric_suffixes. If this parameter is set to false, no name normalization will happen.
Example:
1prometheusremotewrite:2 endpoint: http://example.com3 add_metric_suffixes: false # <-- Disable normalization4 resource_to_telemetry_conversion:5 enabled: true6 auth:7 authenticator: sigv4authFor more details, please refer to our migration guide.
Conclusion
This document has gone over what the basic requirements are to get set up with the ADOT Collector to collect and export Prometheus metrics to AMP. With this, you should be able to use the aforementioned tools to have a clean solution to observability on your software systems.
For more advanced configurations with the ADOT Collector-AMP, please take a look here.
We would love to hear more common configuration scenarios or improvements to this documentation from you! Please submit an issue on the aws-otel community to let us know.