AWS Distro for OpenTelemetry
Basic ECS Configuration for AMP
Basic ECS Configuration for AMP
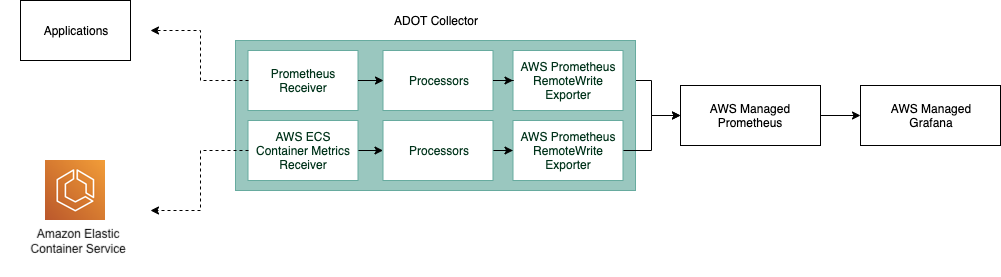
In this guide, we'll enable Prometheus collection for an ECS cluster on EC2 and an ECS cluster on Fargate. In this scenario, we will use the Prometheus Receiver to scrape from applications and the AWS ECS Container Metrics Receiver to scrape infrastructure metrics. We will scrape from an application that provides us with some example Prometheus metrics.
For ECS clusters powered by both AWS Fargate or Amazon EC2, we will create a task definition of an ADOT Collector and a Prometheus metric emitter sample app.
Our ADOT Collector configurations will contain two pipelines.
- To scrape application metrics, we will configure the Prometheus Receiver to scrape application metrics from static hosts and export our metrics using the AWS Prometheus Remote Write Exporter.
- To scrape ECS Metrics, we will configure the AWS ECS Container Metrics Receiver to collect ECS metrics and another AWS Prometheus Remote Write Exporter to export metrics.
Prerequisites
Before getting started, you will need to set up the following components:
- An AMP workspace should be set up. Guides for this can be found here.
- An ECS cluster with Fargate or EC2. If you need to set up an ECS cluster, please use the following guide.
Creating a IAM Policy
We need to create two IAM policies which will give the task role we create later the permissions to execute the actions necessary:
- AWSDistroOpenTelemetryPolicy: This policy will give permissions to create/describe logs and get your ADOT configurations from AWS Systems Manager Parameter Store (SSM Parameter Store).
- AMPRemoteWritePolicy: This policy will give permissions to remote write and query metrics from your AMP instance.
Please follow the steps outlined in this guide: Creating an IAM policy. Note that you will need to use the policies we define below instead.
AWSDistroOpenTelemetryPolicy:
{ "Version": "2012-10-17", "Statement": [ { "Effect": "Allow", "Action": [ "logs:PutLogEvents", "logs:CreateLogGroup", "logs:CreateLogStream", "logs:DescribeLogStreams", "logs:DescribeLogGroups", "logs:PutRetentionPolicy", "ssm:GetParameters" ], "Resource": "*" } ]}AMPRemoteWritePolicy:
{ "Version": "2012-10-17", "Statement": [ { "Effect": "Allow", "Action": [ "aps:RemoteWrite" ], "Resource": "*" } ]}Creating an Task Role
After creating your IAM policies, we need to create a task role to execute the task. We will need to create a task role.
Please follow this guide for creating an IAM role. However, when creating your Task Role (section 1.5), please remember to attach the AMPRemoteWritePolicy we just created above.
Now, we have defined the roles necessary to execute our ECS ADOT Collector configurations. Please follow the section below that fits your ECS cluster.
Building our Sample App Image
We will be using a simple sample app that is used for the integration tests of this pipeline. You can find the sample app here.
First, fork the repository. Then clone the repository and run the following commands:
$ cd ./sample-apps/prometheus$ docker build . -t prometheus-sample-app:latestNext, push this image to a remote repository on either ECR or Dockerhub so that it can be used by the ECS deployment
Demonstration 1: ECS Powered by Fargate
- Download the ECS Fargate AMP task definition template from GitHub. This definition specifies a Prometheus sample app and an ADOT Collector instance. If you would like to learn more about the sample app, please visit here.
- Fill the following parameters in the task definition templates:
region- the region the data will be sent toecsTaskRoleArn- AWSOTTaskRole ARN created in the previous sectionecsExecutionRoleArn- AWSOTTaskExcutionRole ARN created in the previous sectionsampleAppImage- the image to the Prometheus sample app we created above
- Follow the ECS task definition setup instructions, and use the “Fargate Launch Type” instructions step 1 to create a task definition using the given template.
- Be sure to verify all of the fields match the template
- Download the custom ADOT Collector configuration. This configuration uses the Prometheus Receiver to scrape from a static target. Notice that our sample app is automatically deployed on port 8080.
- Fill the following parameters in the ADOT Collector configuration:
region- the region the data will be sent toendpoint- the AMP remote_write endpoint which we will export data to
- Fill the following parameters in the ADOT Collector configuration:
- To use our custom ADOT Collector configuration, we can set up a custom configuration file using SSM Parameter.
- Now, deploy your task on ECS.
Demonstration 2: ECS Powered by Amazon EC2
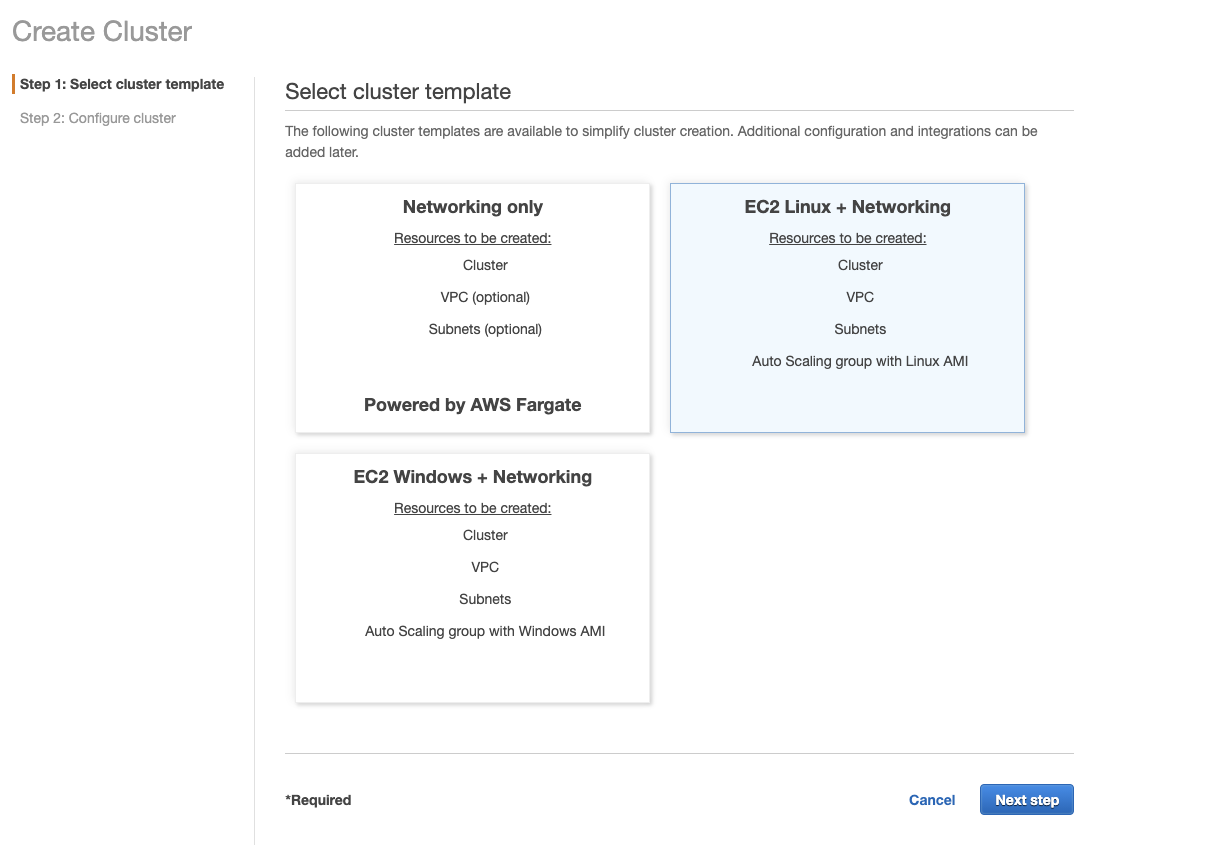
Note that you must have a cluster created with an EC2 instance available. We chose “EC2 Linux + Networking” template. For more detailed cluster setup please refer to the link in the prerequisites section of this document.
- Download the ECS EC2 AMP task definition template from GitHub. This definition specifies a Prometheus sample app and an ADOT Collector instance. If you would like to learn more about the sample app, please visit here.
- Fill the following parameters in the task definition templates:
region- the region the data will be sent toecsTaskRoleArn- AWSOTTaskRole ARN created in the previous sectionecsExecutionRoleArn- AWSOTTaskExcutionRole ARN created in the previous sectionsampleAppImage- the image to the Prometheus sample app we created above
- Follow the ECS task definition setup instructions, and use the “EC2 Launch Type” instructions step 1 to create a task definition using the given template.
- Be sure to verify all of the fields match the template
- Download the custom ADOT Collector configuration. This configuration uses the Prometheus Receiver to scrape from a static target using an environment variable.
- Fill the following parameters in the ADOT Collector configuration:
region- the region the data will be sent toendpoint- the AMP remote_write endpoint which we will export data to
- Fill the following parameters in the ADOT Collector configuration:
- To use our custom ADOT Collector configuration, we can set up a custom configuration file using SSM Parameter.
- Now, deploy your task on ECS.
It works!
Query for AMP metrics
In order to test if AMP received those metrics, we can use the awscurl. This tool allows us to send HTTPs requests through the command line with AWS Sigv4 authentication. In order to use this, make sure you have set the correct permissions to query from AMP in your local AWS credentials. Please use this guide to install awscurl.
You can use the following command below to check if a metric was received in AMP. The region and AMP_ENDPOINT will have to be changed corresponding to your AMP workspace.
$ awscurl --service="aps" --region="region" "https://{AMP_ENDPOINT}/api/v1/query?query=adot_test_gauge0"{"status":"success","data":{"resultType":"vector","result":[{"metric":{"__name__":"adot_test_gauge0"},"value":[1606512592.493,"16.87214000011479"]}]}}Note: we added a namespace: adot value in the ADOT Collector yaml file to prefix each metric that is exported by ADOT Collector with adot_.
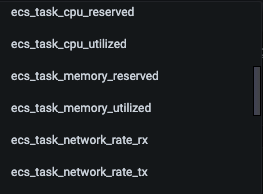
Visualize metrics in AWS Managed Service for Grafana
If you are using AWS Managed Service for Grafana (AMG), we can visualize and list the metrics we found. For example, the AWS ECS Container Metrics Receiver will produce the following metrics: