AWS Distro for OpenTelemetry
Logz.io Exporter
Logz.io Exporter
Overview
Logz.io provides observability and monitoring into infrastructure and applications including logs, metrics, and traces using the best open source tools today including ELK, Prometheus, and Jaeger. The AWS Distro for Open Telemetry includes the Logzio exporter, which takes OpenTelemetry data (metrics and traces) collected by the ADOT Collector and allows for pipelines to sample and process the data before sending it to the Logz.io SaaS application to be analyzed further.
Prerequisites
- Download the ADOT Collector.
- Deploy the ADOT Collector.
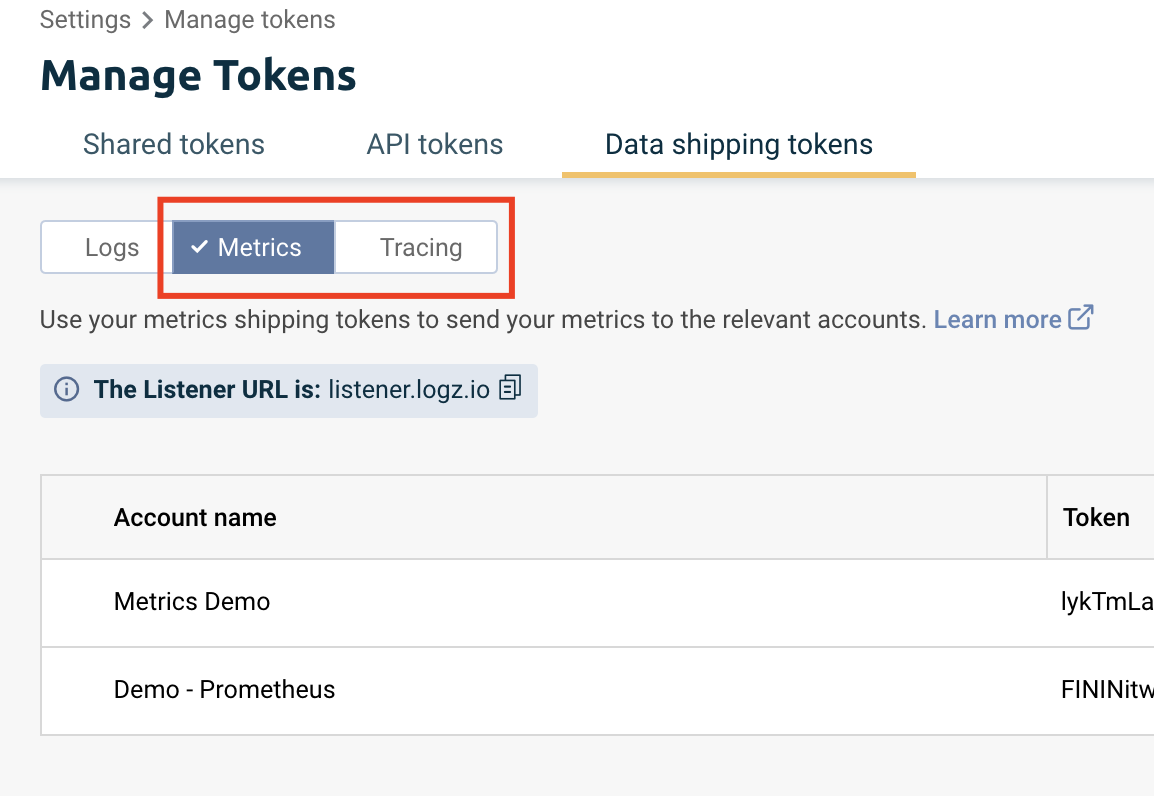
- Get a copy of your Logz.io API keys. Depending on the data you’re about to send to Logz.io (Metrics data or Tracing data, or both), you’ll need to grab a Metrics token and a Tracing token.

Logz.io supports multiple data sources (or accounts) for Metrics and Tracing: Make sure you use the specific token for the data source (account) you intend to send the data to.
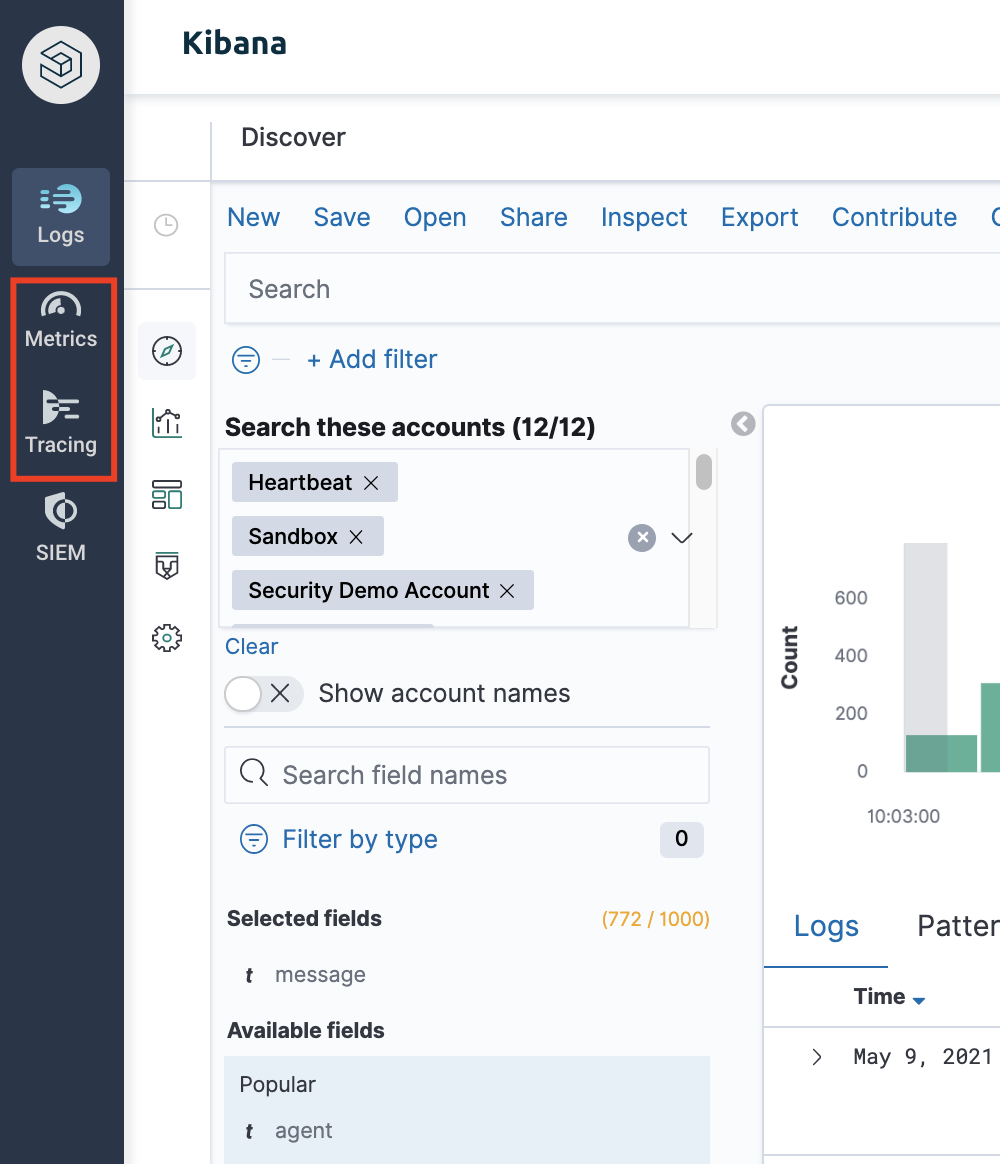
If you don't already have a Logz.io account, sign up for a Logz.io Trial Account. Once your account is created, in the platform menu tabs, activate your Metrics and Tracing plans:

Configuring the Logz.io Exporter
To send data to Logz.io you will need to configure the ADOT collector. Trace data and Metric data are configured separately. The only change needed to your OpenTelemetry configuration is to add the Logz.io exporter. This is the component used to direct the data to Logz.io from the AWS OpenTelemetry collector. Add a Logz.io exporter to the YAML file for your OpenTelemetry configuration, along with your Logz.io tokens. Check out the exporter part of the sample yaml file that is available from OpenTelemetry.
Note that based on your deployment, you’ll need to use your customized OpenTelemetry collector configuration changes, instead of the default OpenTelemetry file available from the AWS Distro.
Logzio Exporter
This exporter supports sending both trace and metrics data to Logz.io
The following configuration options are supported:
account_token(Required if you are sending trace data): Your logz.io account token for your tracing account.regionYour Logz.io account 2 letter region code. Defaults to ‘us’. Required ONLY if your Logz.io region is different from US. See this page to find out your region code.custom_endpoint(Optional): Custom endpoint for the tracing backend, mostly used for dev or testing. This will override the region parameter.endpoint(Required if you are sending metrics data): The listener endpoint of the Logz.io prometheus backend. The listener URL is also dependent on your region and can be retrieved from the column “Listener host” in the regions page. Note that the port is always 8053.Authorization(Required if you are sending metrics data): Your Logz.io metrics token as part of the Prometheus write configuration section. The token value should be placed instead of the placeholder LOGZIOprometheusTOKEN
Example:
exporters: logzio: account_token: "youLOGZIOtraceTOKEN" region: "us"
prometheusremotewrite: endpoint: "https://listener.logz.io:8053" headers: Authorization: "Bearer LOGZIOprometheusTOKEN"This is a sample configuration which would be part of a larger configuration of your OpenTelemetry collector
Check out your data in Logz.io
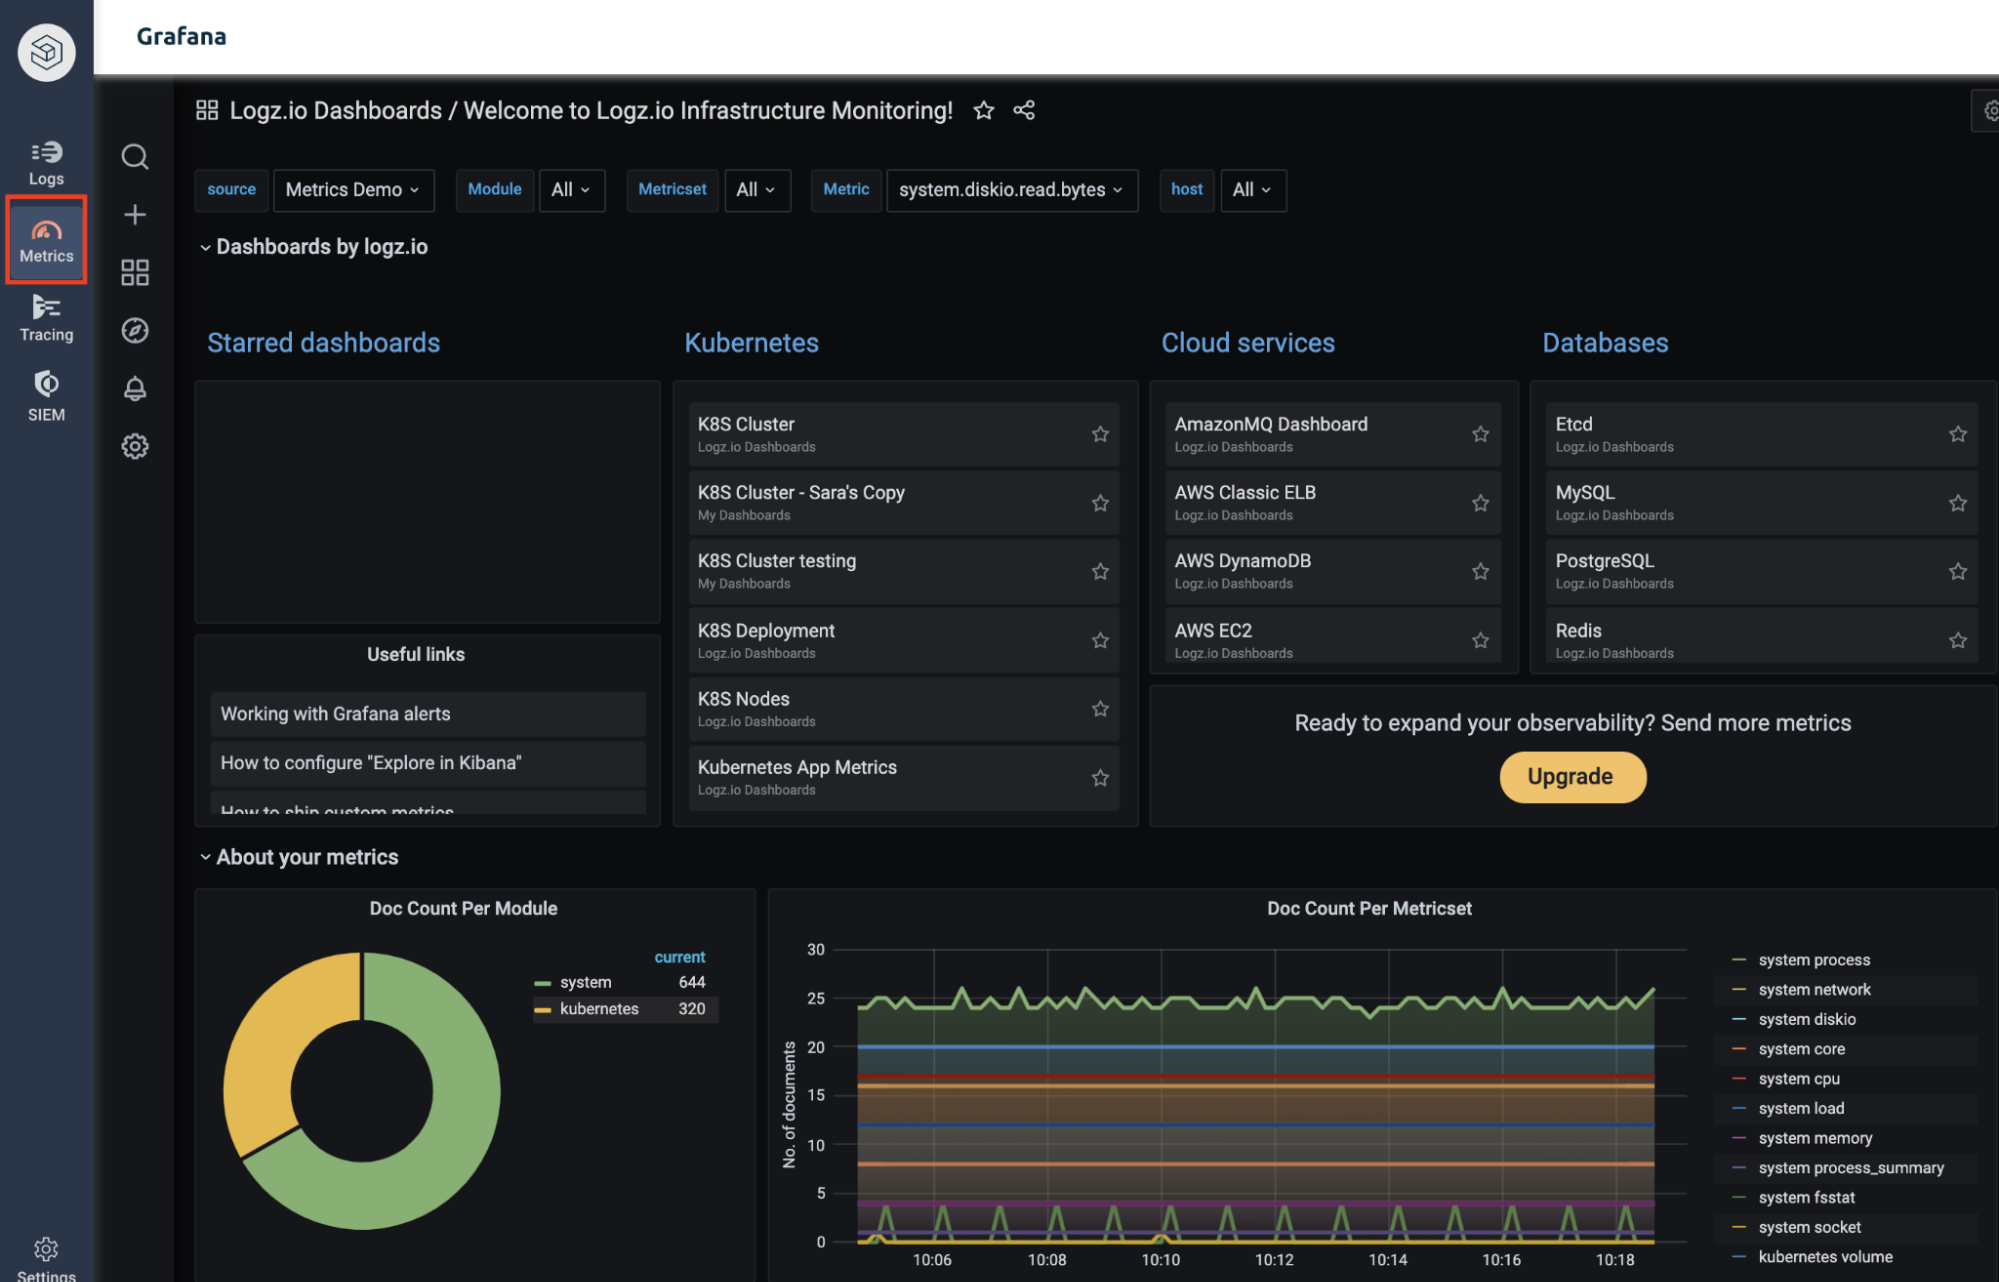
Once the exporter is configured, and metrics or traces have been sent to your Logz.io account, you can see and explore the data in the Logz.io platform application. Access your Logz.io account via https://app.logz.io To start creating visualizations and dashboards using Grafana, access your Metrics tab from the application.

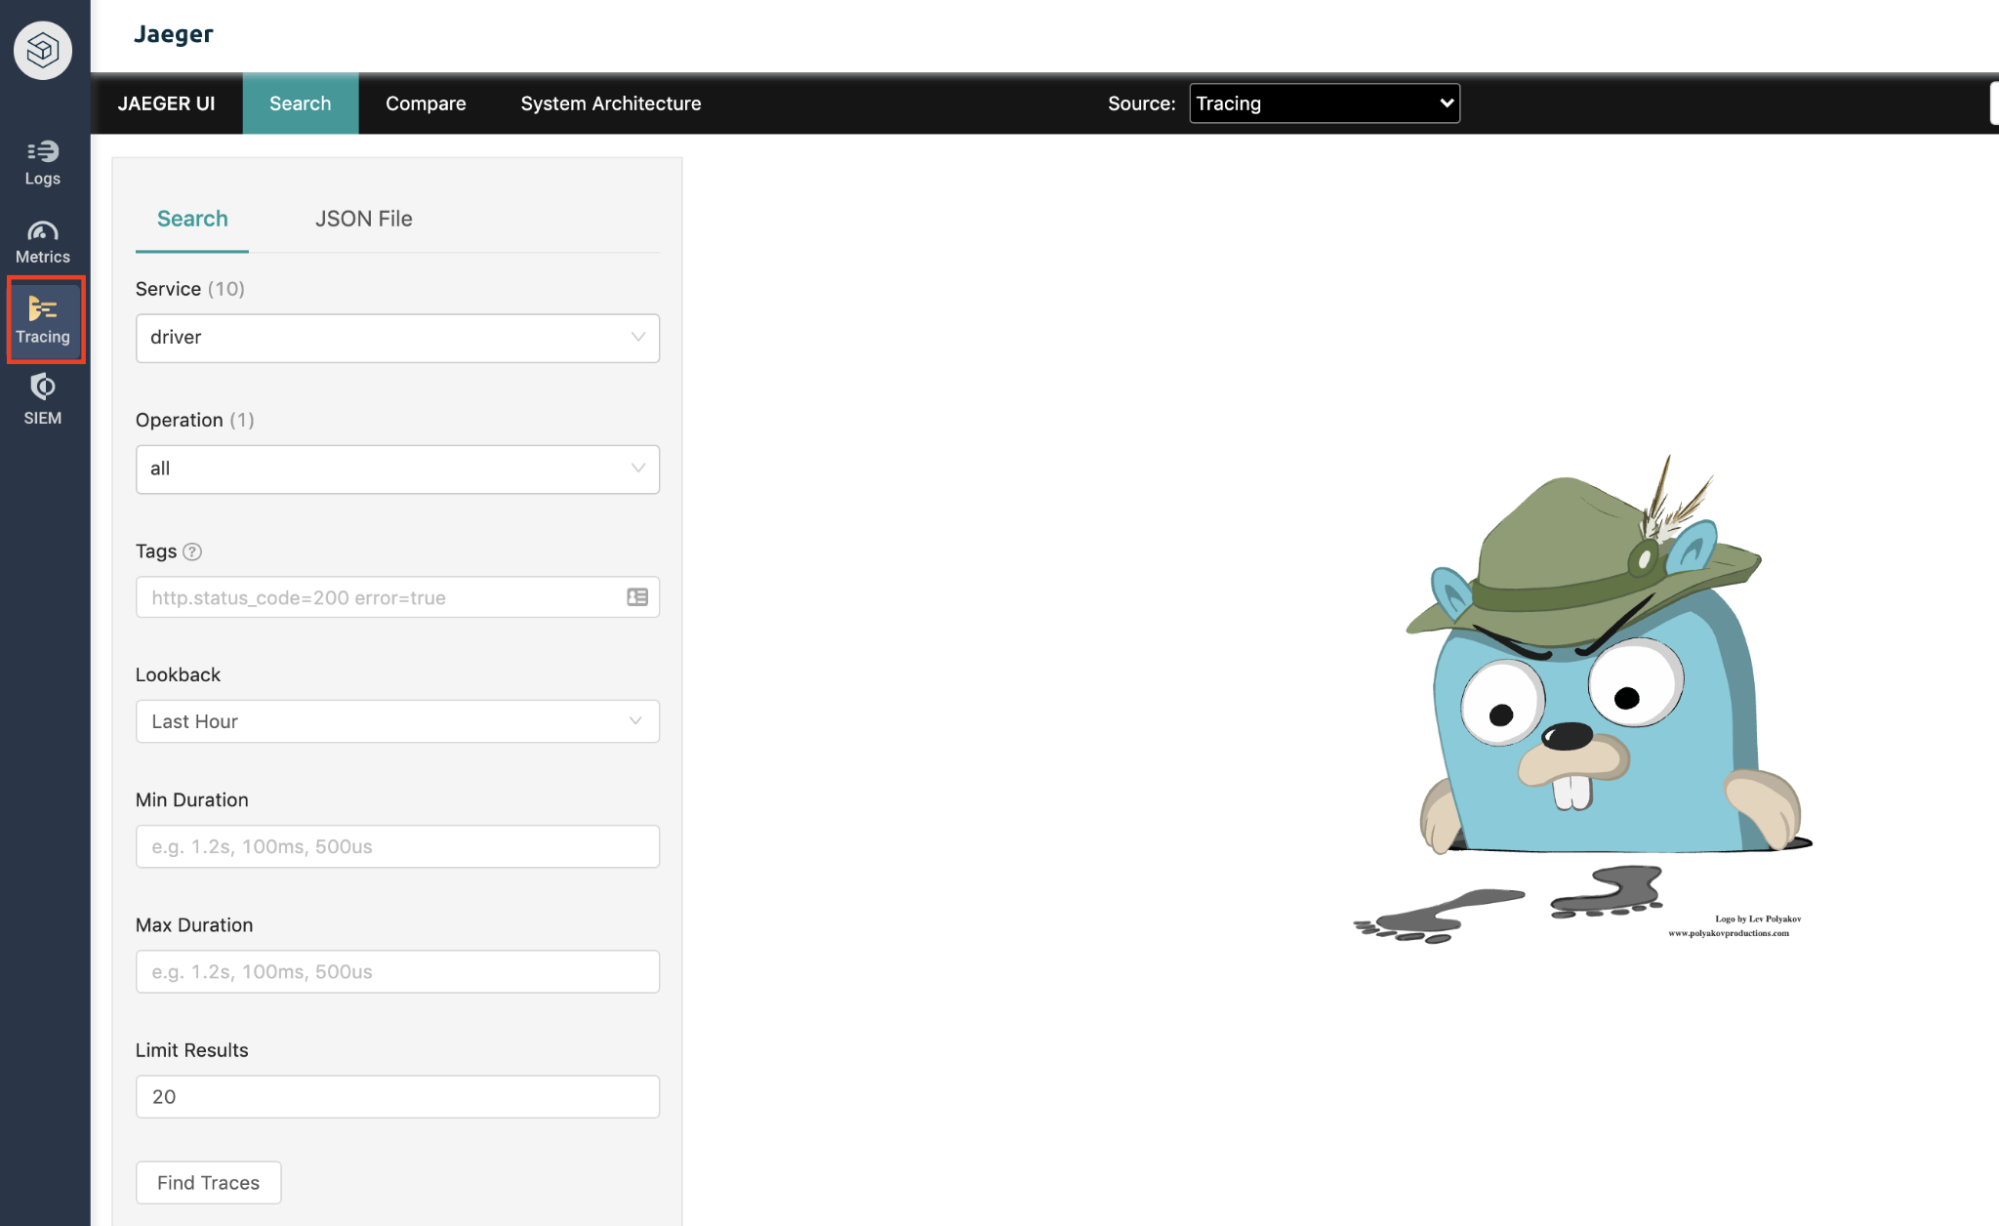
To start analyzing your trace data using Jaeger, access your Tracing tab from the application.

Support
Need help? Once you're logged in to your Logz.io account, our Support team is available 24X7 through the chat bubble located at the bottom right corner of the Logz.io platform. Our live Support Engineers (real people - not bots!) are available to take any question within minutes.