AWS Distro for OpenTelemetry
Kubernetes Attributes Processor
Kubernetes Attributes Processor
In OpenTelemetry, a resource represents the source of telemetry signals, for example, a pod in Kubernetes that exposes Prometheus metrics. The Kubernetes attributes processor allows for the automatic setting of span and metric resource attributes with Kubernetes metadata. More information in OpenTelemetry resources can be found in the official documentation here.
How the Kubernetes Attributes Processor works
A collector receiver is responsible for storing the connection ip, the ip address in which the signal originated from, in the telemetry signals context for use by subsequent components. By default, if the connection ip is available, the Kubernetes attributes processor will attempt match the connection ip to a pods ip. If a match is made pod metadata is attached as resource attributes. Additional association rules can also be specified if the connection ip is not available. The Kubernetes attributes processor README has more detailed information on processor configuration options.
How can I leverage these new resource attributes?
After the Kubernetes attributes processor associates a data point with a Kubernetes pod it will automatically attach Kubernetes pod metadata as resource attributes. The default list of resource attributes populated can be found within the Kubernetes attributes processor module. Additional resource attributes from a pre-defined list can be selected using the configuration. Knowing how to leverage these new resource attributes is entirely up to you. In the following two sections we will provide examples in which these resource attributes can be utilized to enhance your observability solution. First, we will introduce a scenario that will leverage the resource attributes in a subsequent collector processor. Second, we will present a few different places where Kubernetes resource attributes can be used after exporting out of the collector and into a backed of your choosing.
Gateway collector example
In the following example we have two applications that are instrumented with OpenTelemetry SDKs. One application will send telemetry signals directly to a gateway collector and the other is connected to a proxy. The proxy is responsible for forwarding the telemetry signals to the gateway. The gateway collector is a collector which receives all telemetry signals over a single OTLP endpoint before exporting them out of the cluster. The OpenTelemetry documentation provides more details about the gateway deployment pattern. Telemetry signals not sent directly to the gateway collector must have Kubernetes resource attributes populated so that the Kubernetes attributes processor can perform associations. OpenTelemetry SDKs allows configuration of resource attributes through environment variables. The Kubernetes downward api can be used to make metatadata fields available to the SDK environment variable.
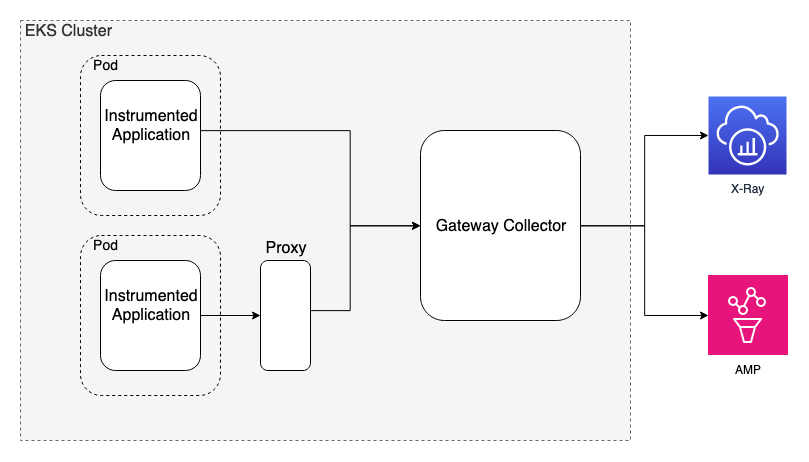
This example scenario can support multiple telemetry sources as long as the data ends up at our single gateway collector.
The following collector configuration would be used by the gateway ADOT collector.
extensions: sigv4auth: region: us-west-2 service: "aps"
receivers: otlp: grpc: http:
processors: batch:
exporters: prometheusremotewrite: endpoint: fake.amp.endpoint auth: authenticator: sigv4auth awsxray:
service: extensions: [sigv4auth] pipelines: metrics: receivers: [otlp] processors: [batch] exporters: [prometheusremotewrite] traces: receivers: [otlp] processors: [batch] exporters: [awsxray]The starting configuration does not do much. Metrics and traces are ingested using an OTLP receiver which are then exported to Amazon Managed Service for Prometheus (AMP) and AWS X-Ray respectively.
Our observability solution now has a new requirement. We need to drop all metric and traces which flow through or originate from a specific node. The first step to accomplish this is to ensure that all data points have the necessary resource attributes attached to them. To do this we will configure our Kubernetes attributes processor. During this step we also add the indexed_attributes field in the x-ray exporter. The indexed_attributes option ensures that the k8s.node.name resource attribute is searchable in AWS X-Ray.
extensions: sigv4auth: region: us-west-2 service: "aps"
receivers: otlp: grpc: http:
processors: k8sattributes: pod_association: # for telemetry signals that may have came through a proxy - sources: - from: resource_attribute name: k8s.pod.uid - from: resource_attribute name: k8s.namespace.name # for telemetry signals that are sent directly to the gateway - sources: - from: connection batch:
exporters: prometheusremotewrite: endpoint: fake.amp.endpoint auth: authenticator: sigv4auth awsxray: indexed_attributes: [otel.resource.k8s.node.name]
service: extensions: [sigv4auth] pipelines: metrics: receivers: [otlp] processors: [k8sattributes, batch] exporters: [prometheusremotewrite] traces: receivers: [otlp] processors: [k8sattributes, batch] exporters: [awsxray]After our Kubernetes attributes processor is configured we can then leverage additional processors that are available in the ADOT collector. To drop metrics we will utilize the filter processor and to sample out traces we will leverage the group by trace and tail sampling processor. The advanced sampling documentation page providers a deeper look into advanced sampling configurations.
extensions: sigv4auth: region: us-west-2 service: "aps"
receivers: otlp: grpc: http:
processors: k8sattributes: pod_association: - sources: - from: resource_attribute name: k8s.pod.uid - from: resource_attribute name: k8s.namespace.name - sources: - from: connection groupbytrace: tailsampling: policies: [ { name: node-policy, type: string_attribute, string_attribute: {key: k8s.node.name, values: [badnode-1234]} } ] filter: metrics: exclude: resource_attributes: - key: k8s.node.name value: badnode-1234 batch:
exporters: prometheusremotewrite: endpoint: fake.amp.endpoint resource_to_telemetry_conversion: enabled: true auth: authenticator: sigv4auth awsxray: indexed_attributes: [otel.resource.k8s.node.name]
service: extensions: [sigv4auth] pipelines: metrics: receivers: [otlp] processors: [k8sattributes, filter, batch] exporters: [prometheusremotewrite] traces: receivers: [otlp] processors: [k8sattributes, groupbytrace, tailsampling, batch] exporters: [awsxray]Our final configuration is complete. While this example is very small and very specific the idea is to show you the different ways Kubernetes resource attributes processor can be used within a collector pipeline. Being able to reliably associate pod metadata with incoming telemetry signals can come in handy in many ways! Next, we will give you a few more ideas on where these resource attributes can be used outside of a collector.
Using Kubernetes resource attributes outside of a collector
Kubernetes resources are useful outside of the collector also. Below are some different places where these resource attributes can come in handy. Generally, resource attributes can assist you in narrowing down queries while troubleshooting or aggregating data across a specific set of Kubernetes resources.
- Visualize your Prometheus metrics in Amazon Managed Grafana. Use Grafana dashboards to query data based on Kubernetes resource attributes. Use the resource_to_telemetry_conversion configuration option to translate resource attributes to Prometheus labels.
- Use Kubernetes resource attributes to filter traces in X-Ray based on annotations values.
The AWS X-Ray developer guides provides more information about filtering with complex keywords.
Use the
indexed_attributesconfiguration option in the X-Ray exporter to ensure that the resource attributes are searchable. - If you leverage the AWS EMF exporter, enable resource_to_telemetry_conversion to make Kubernetes resource attributes available to the EMF Exporter. New dimension sets, dashboards, and alarms that can leverage Kubernetes resource attributes.