AWS Distro for OpenTelemetry
Container Insights ECS Prometheus
Container Insights ECS Prometheus
GettingStarted / Container Insights / Container Insights for Prometheus Support
Overview
To collect Prometheus metrics from tasks running on ECS and send it to CloudWatch using AWS Distro for OpenTelemetry Collector (ADOT). You can either run the collector as a sidecar or deploy the collector as its own ECS service for entire cluster. To use the pre-built dashboard in CloudWatch, you need to run a single collector for the entire cluster to attach task and service metadata. ECS tasks with Prometheus endpoints are discovered using extension ecsobserver. (Unlike EKS, there is no builtin discovery for ECS inside prometheus)
Steps
Follow these steps to run the ADOT Collector and Prometheus workload on ECS. You can skip some of them if you already have clusters or tasks running.
- Create an ECS cluster based on tutorial or follow Appendix to Create ECS cluster with EC2 instances using ecs-cli
- Create IAM role and configure IAM policy. Discovery tasks requires extra ECS policies.
- Create Configuration as an SSM parameter
- Create ECS Task Definition
- Deploy ADOT Collector as a replica service with 1 replica
- Deploy sample workloads
- View logs and metrics in the CloudWatch console
- View pre-built CloudWatch dashboards
Permission
For discovering ECS tasks, you need to config IAM policy. For scraping discovered targets, you need to configure network
IAM Policy
Extra IAM policies are required to discover ECS tasks with Prometheus metrics.
The full document with existing polices is included in the appendix IAM Policy Document.
NOTE: The EC2 policy is required if you use ECS EC2 with bridge network mode. You can remove it if all your tasks are fargate or uses awsvpc network mode.
ec2:DescribeInstancesecs:ListTasksecs:ListServicesecs:DescribeContainerInstancesecs:DescribeServicesecs:DescribeTasksecs:DescribeTaskDefinitionNetwork
For the ADOT Collector to scrape metrics, connectivity between ECS tasks using private ip is required. Depends on how the cluster is created, you may need to configure security group to allow ingress within current VPC as prometheus pull metrics. The default VPC's security group normally allows ingress within VPC out of box, while some CLI tools such as ecs-cli creates new VPC with stricter rules.
When defining inbound rules, you can specify a strict port range if your task is using awsvpc as the network mode
(ECS Fargate only use awsvpc). However, for ECS bridge network mode (only on EC2), the host port is random
so you have to allow inbound on all TCP ports within the VPC.
# Enable all TCP inbound within same VPCSG=sg-123456aws ec2 authorize-security-group-ingress --group-id ${SG} --protocol tcp --port 0-65535 --source-group ${SG}Configuration
Configuring Container Insight Prometheus is similar to normal Prometheus pipeline.The overall flow of pipeline is:
- Extension
ecsobservercall AWS API and write discovered targets to a file in a folder that already exists such as/etc/ecs_sd_targets.yaml. A detailed explanation forecsobserverconfig is in its source. - The Prometheus receiver includes the output file from
ecsobserverusingfile_sd. - Prometheus relabel and EMF exporter's
metric_declarationstransform and select the right set of labels as CloudWatch dimensions.
A full example can be found in examples/ecs/aws-cloudwatch/ecs-container-insights-prometheus.yaml.
It contains discovery and metrics extraction rule for all workloads. NOTE: Remember to replace {{cluster_name}} in the example file.
Following is a small example for JMX and NGINX using service and docker label based discovery with inline comments.
extensions: ecs_observer: # extension type is ecs_observer cluster_name: 'my-ecs-cluster' # cluster name need to configured manually cluster_region: 'us-west-2' # region can be configured directly or use AWS_REGION env var result_file: '/etc/ecs_sd_targets.yaml' # the directory for file must already exists refresh_interval: 60s # format is https://golang.org/pkg/time/#ParseDuration # custom name for 'job' so we can rename it back to 'job' using metricstransform processor job_label_name: prometheus_job # NGINX https://docs.aws.amazon.com/AmazonCloudWatch/latest/monitoring/ContainerInsights-Prometheus-Setup-nginx-ecs.html services: - name_pattern: '^.*nginx-service$' # NGINX metrics_ports: - 9113 job_name: nginx-prometheus-exporter # JMX docker_labels: - port_label: 'ECS_PROMETHEUS_EXPORTER_PORT'
receivers: prometheus: config: scrape_configs: - job_name: "ecssd" file_sd_configs: - files: - '/etc/ecs_sd_targets.yaml' # MUST match the file name in ecs_observer.result_file relabel_configs: # Relabel here because label with __ prefix will be dropped by receiver. - source_labels: [ __meta_ecs_cluster_name ] # ClusterName action: replace target_label: ClusterName - source_labels: [ __meta_ecs_service_name ] # ServiceName action: replace target_label: ServiceName - source_labels: [ __meta_ecs_task_definition_family ] # TaskDefinitionFamily action: replace target_label: TaskDefinitionFamily - source_labels: [ __meta_ecs_task_launch_type ] # LaunchType action: replace target_label: LaunchType - source_labels: [ __meta_ecs_container_name ] # container_name action: replace target_label: container_name - action: labelmap # Convert docker labels on container to metric labels regex: ^__meta_ecs_container_labels_(.+)$ # Capture the key using regex, e.g. __meta_ecs_container_labels_Java_EMF_Metrics -> Java_EMF_Metrics replacement: '$$1'
processors: resource: attributes: - key: receiver # Insert receiver: prometheus for CloudWatch EMF Exporter to add prom_metric_type value: "prometheus" action: insert metricstransform: transforms: - include: ".*" # Rename customized job label back to job match_type: regexp action: update operations: - label: prometheus_job # must match the value configured in ecs_observer new_label: job action: update_label
exporters: awsemf: namespace: ECS/ContainerInsights/Prometheus # Use the exact namespace for builtin dashboard to work log_group_name: "/aws/ecs/containerinsights/my-ecs-cluster/prometheus" # Log group name format is fixed as well, the only variable is cluster name dimension_rollup_option: NoDimensionRollup metric_declarations: # NGINX - dimensions: [ [ ClusterName, TaskDefinitionFamily, ServiceName ] ] # dimension names are same as our relabeled keys. label_matchers: - label_names: - ServiceName regex: '^.*nginx-service$' metric_name_selectors: - "^nginx_.*$" # JMX - dimensions: [ [ ClusterName, TaskDefinitionFamily, area ] ] label_matchers: - label_names: - Java_EMF_Metrics # Label in metrics comes from docker label in task definition regex: ^true$ metric_name_selectors: - "^jvm_memory_bytes_used$"
service: extensions: [ ecs_observer ] # extension is declared outside pipelines pipelines: metrics: receivers: [ prometheus ] processors: [ resource, metricstransform ] exporters: [ awsemf ]Deploy ADOT Collector
ADOT Collector needs to run as single instance. We use the replica service because it handles task failure.
Replica is 1 otherwise we will have duplicated metrics.
If you have a large cluster, you can shard the scrape targets using hashmod or use different discovery configurations for multiple collectors.
# Run ADOT Collector as replica service on EC2# https://docs.aws.amazon.com/cli/latest/reference/ecs/create-service.htmlaws ecs create-service \ --cluster my-ecs-cluster \ --service-name adot-ecs-prometheus \ --task-definition adot-ecs-prometheus:1 \ --desired-count 1`
Sample Workloads
There are four workloads with pre-built dashboards, JMX is the easiest to get started with.
JMX
Details about example JMX workload can be found from CloudWatch docs ECS JMX Sample and ECS JMX Metrics Collected
Our integration test also includes a sample java app.
NGINX
Detail about the example NGINX workload can be found from CloudWatch docs ECS Nginx Sample nginx-prometheus-exporter is an open source project.
NGINX Plus
NGINX Plus is similar to NGINX but requires subscription. Instruction for building image and run the workload can be found from CloudWatch docs Build Nginx Plus Image
AWS App Mesh
CloudWatch docs has a simple walk through ECS App Mesh Sample. Be aware it's not easy to set up Mesh. All the metrics (used in dashboard) are collected from Envoy.
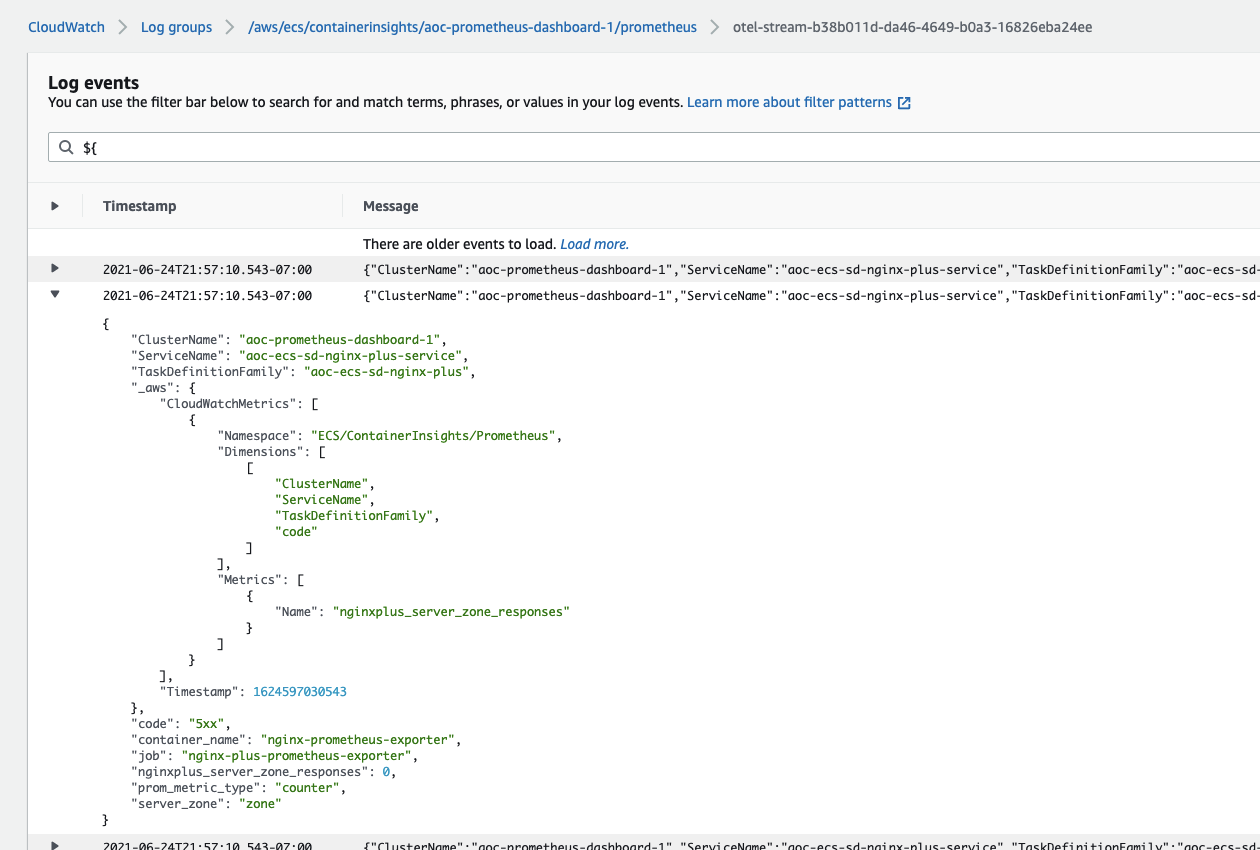
View logs and metrics in the CloudWatch console
The log group is named after cluster. For example, /aws/ecs/containerinsights/my-cluster/prometheus.
By default, the log stream name is otel-stream with a random suffix added.
The _aws part in log defines which fields are going to be extracted as metrics dimensions.
You can query all the fields using CloudWatch Logs filter pattern
or Logs Insights.
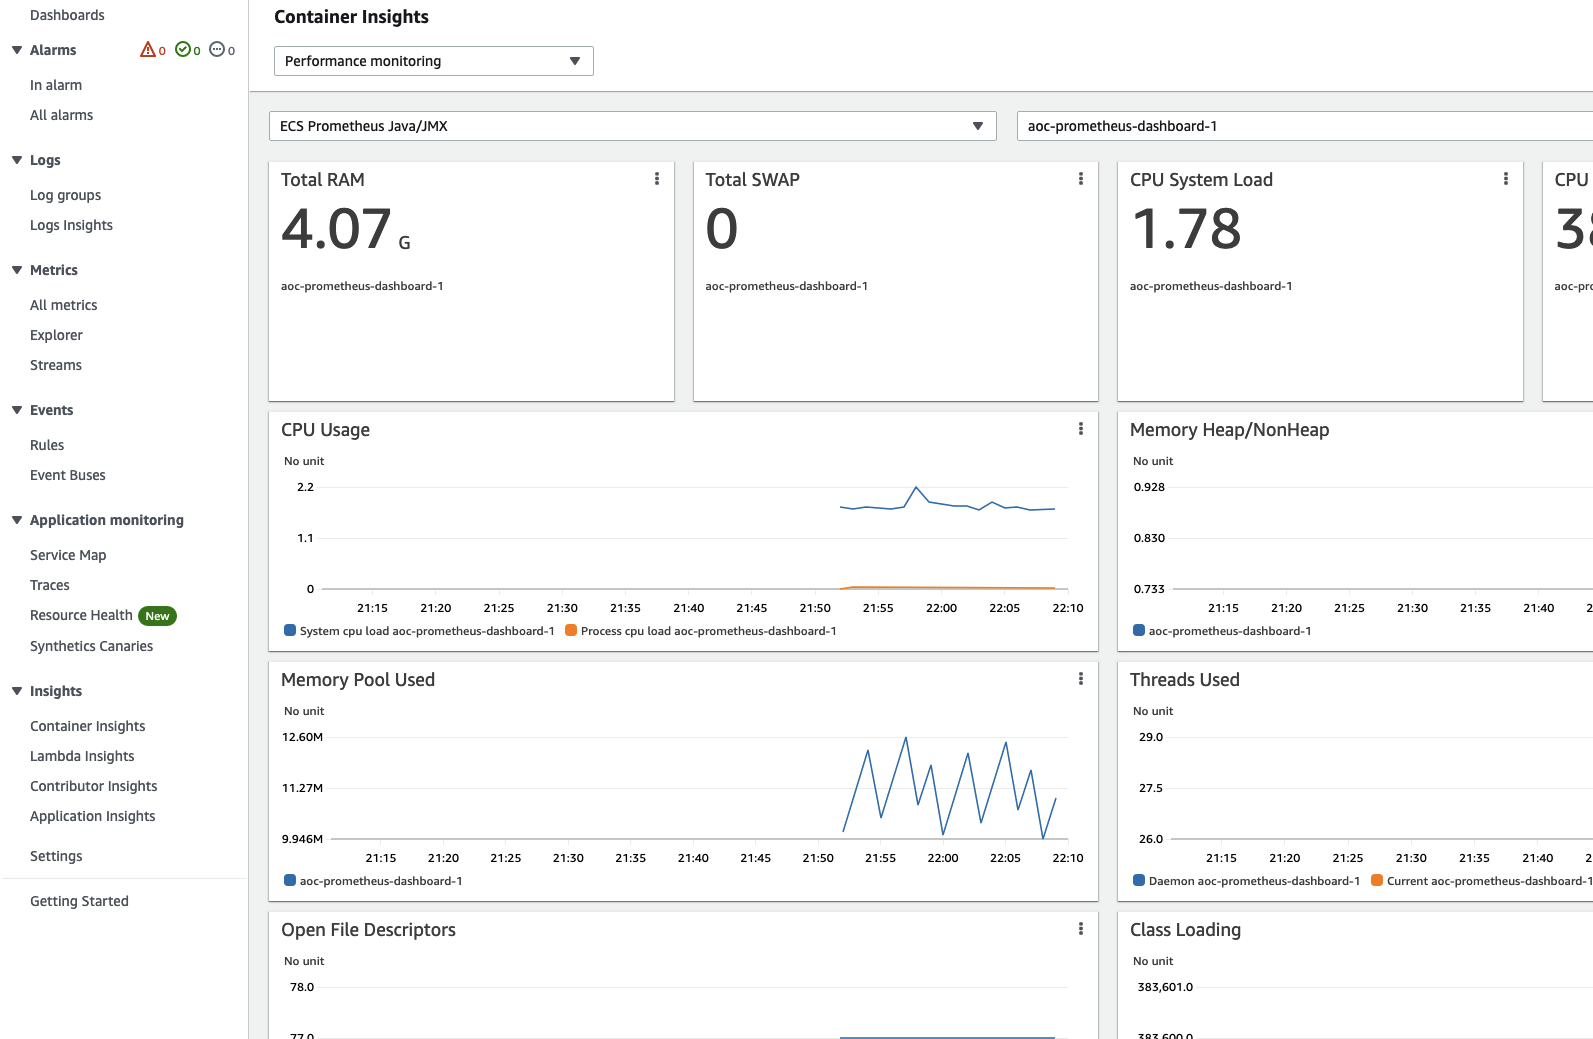
View pre-built CloudWatch dashboards
Pre-built dashboards can be found from sidebar Insights > Container Insights.
Choose Performance monitoring from the drop-down and select your workload e.g. ECS Prometheus Java/JMX.
You should find your cluster on the right dropdown.
Appendix
Create ECS Cluster with EC2 instances
- Download ecs-cli.
- Create a new cluster, take note of the security group and subnet it created.
- If you missed it, you can still find it from CloudFormation console,
ecs-cligenerates CloudFormation and applies it. - To make testing easier, update security group to allow ingress on all TCP port within the cluster, this makes testing easier. However, you might want to only allow specific port when you use non bridge network mode. Bridge network mode assigns random host ports so you have to allow all.
- Delete the cluster by either deleting the AWS CloudFormation stack or using
ecs-cli down -f -cluster ${CLUSTER_NAME}
# Create ECS EC2 cluster with 2 EC2 instances
export CLUSTER_NAME=aoc-containerinsight-prometheus-exampleecs-cli up --capability-iam --size 2 --instance-type t2.medium --cluster ${CLUSTER_NAME} --region us-west-2
# Output is like# INFO[0000] Using recommended Amazon Linux 2 AMI with ECS Agent 1.51.0 and Docker version 19.03.13-ce# INFO[0001] Created cluster cluster=aoc-containerinsight-prometheus-example region=us-west-2# INFO[0001] Waiting for your cluster resources to be created...# INFO[0122] Cloudformation stack status stackStatus=CREATE_IN_PROGRESS# VPC created: vpc-0fcxxxxx# Security Group created: sg-04xxxxx# Subnet created: subnet-03xxxx# Subnet created: subnet-0exxxx# Cluster creation succeeded.
# Update security group to allow ingress on all ports within security groupSG=sg-04xxxxxaws ec2 authorize-security-group-ingress --group-id ${SG} --protocol tcp --port 0-65535 --source-group ${SG}aws ec2 describe-security-groups --group-ids ${SG}IAM Policy Document
Policy document merged from ECS setup guide and Extra IAM Policy.
{ "Version": "2012-10-17", "Statement": [ { "Effect": "Allow", "Action": [ "logs:PutLogEvents", "logs:CreateLogGroup", "logs:CreateLogStream", "logs:DescribeLogStreams", "logs:DescribeLogGroups", "logs:PutRetentionPolicy", "xray:PutTraceSegments", "xray:PutTelemetryRecords", "xray:GetSamplingRules", "xray:GetSamplingTargets", "xray:GetSamplingStatisticSummaries", "cloudwatch:PutMetricData", "ec2:DescribeVolumes", "ec2:DescribeTags", "ssm:GetParameters" "ec2:DescribeInstances", "ecs:ListTasks", "ecs:ListServices", "ecs:DescribeContainerInstances", "ecs:DescribeServices", "ecs:DescribeTasks", "ecs:DescribeTaskDefinition" ], "Resource": "*" } ]}ECS Task Definition
NOTE: You need to replace placeholder values with actual value
- The account id in the example is
123456and is used in ARN for taskRole and executionRole, replace it with your own AWS account id. amazon/aws-otel-collector:v0.11.0is using dockerhub (potential throttle) and you can uselatesttag if you don't want to lock version.- Collecting infrastructure metrics requires running ADOT Collector with root access and this can be configured through
userin the container definition. /aoc/ecs-prometheusis the name of SSM parameter.networkModecan bebridge,host,awsvpc. For fargate, it has to beawsvpc.logConfigurationis for log from ADOT Collector itself. Log groups for metrics/log collected by collector is configured usingAOT_CONFIG_CONTENT.requiresCompatibilitiesincludes both EC2 and Fargate because ADOT Collector is scraping metrics via HTTP and does not need special host level access.cpuandmemorymust follow Fargate's requirement e.g.cpu 255 memory 511is invalid pair.
{ "family": "adot-ecs-prometheus", "taskRoleArn": "arn:aws:iam::123456:role/MyEcsTaskRole", "executionRoleArn": "arn:aws:iam::123456:role/MyEcsTaskExecutionRole", "networkMode": "bridge", "containerDefinitions": [ { "name": "adot", "image": "amazon/aws-otel-collector:v0.11.0", "user": "root", "secrets": [ { "name": "AOT_CONFIG_CONTENT", "valueFrom": "/aoc/ecs-prometheus" } ], "logConfiguration": { "logDriver": "awslogs", "options": { "awslogs-create-group": "True", "awslogs-group": "/adot/collector", "awslogs-region": "us-west-2", "awslogs-stream-prefix": "ecs-prometheus" } } } ], "requiresCompatibilities": [ "EC2", "FARGATE" ], "cpu": "256", "memory": "512"}