AWS Distro for OpenTelemetry
Container Insights EKS Fargate
Container Insights EKS Fargate
This section shows the design of components in an ADOT Collector pipeline that enables the collection of Container Insights metrics from EKS Fargate workloads and explains how to configure and deploy an ADOT Collector to collect system metrics from workloads deployed to an EKS Fargate cluster and send them to CloudWatch.
Design of Container Insights support in ADOT Collector for EKS Fargate
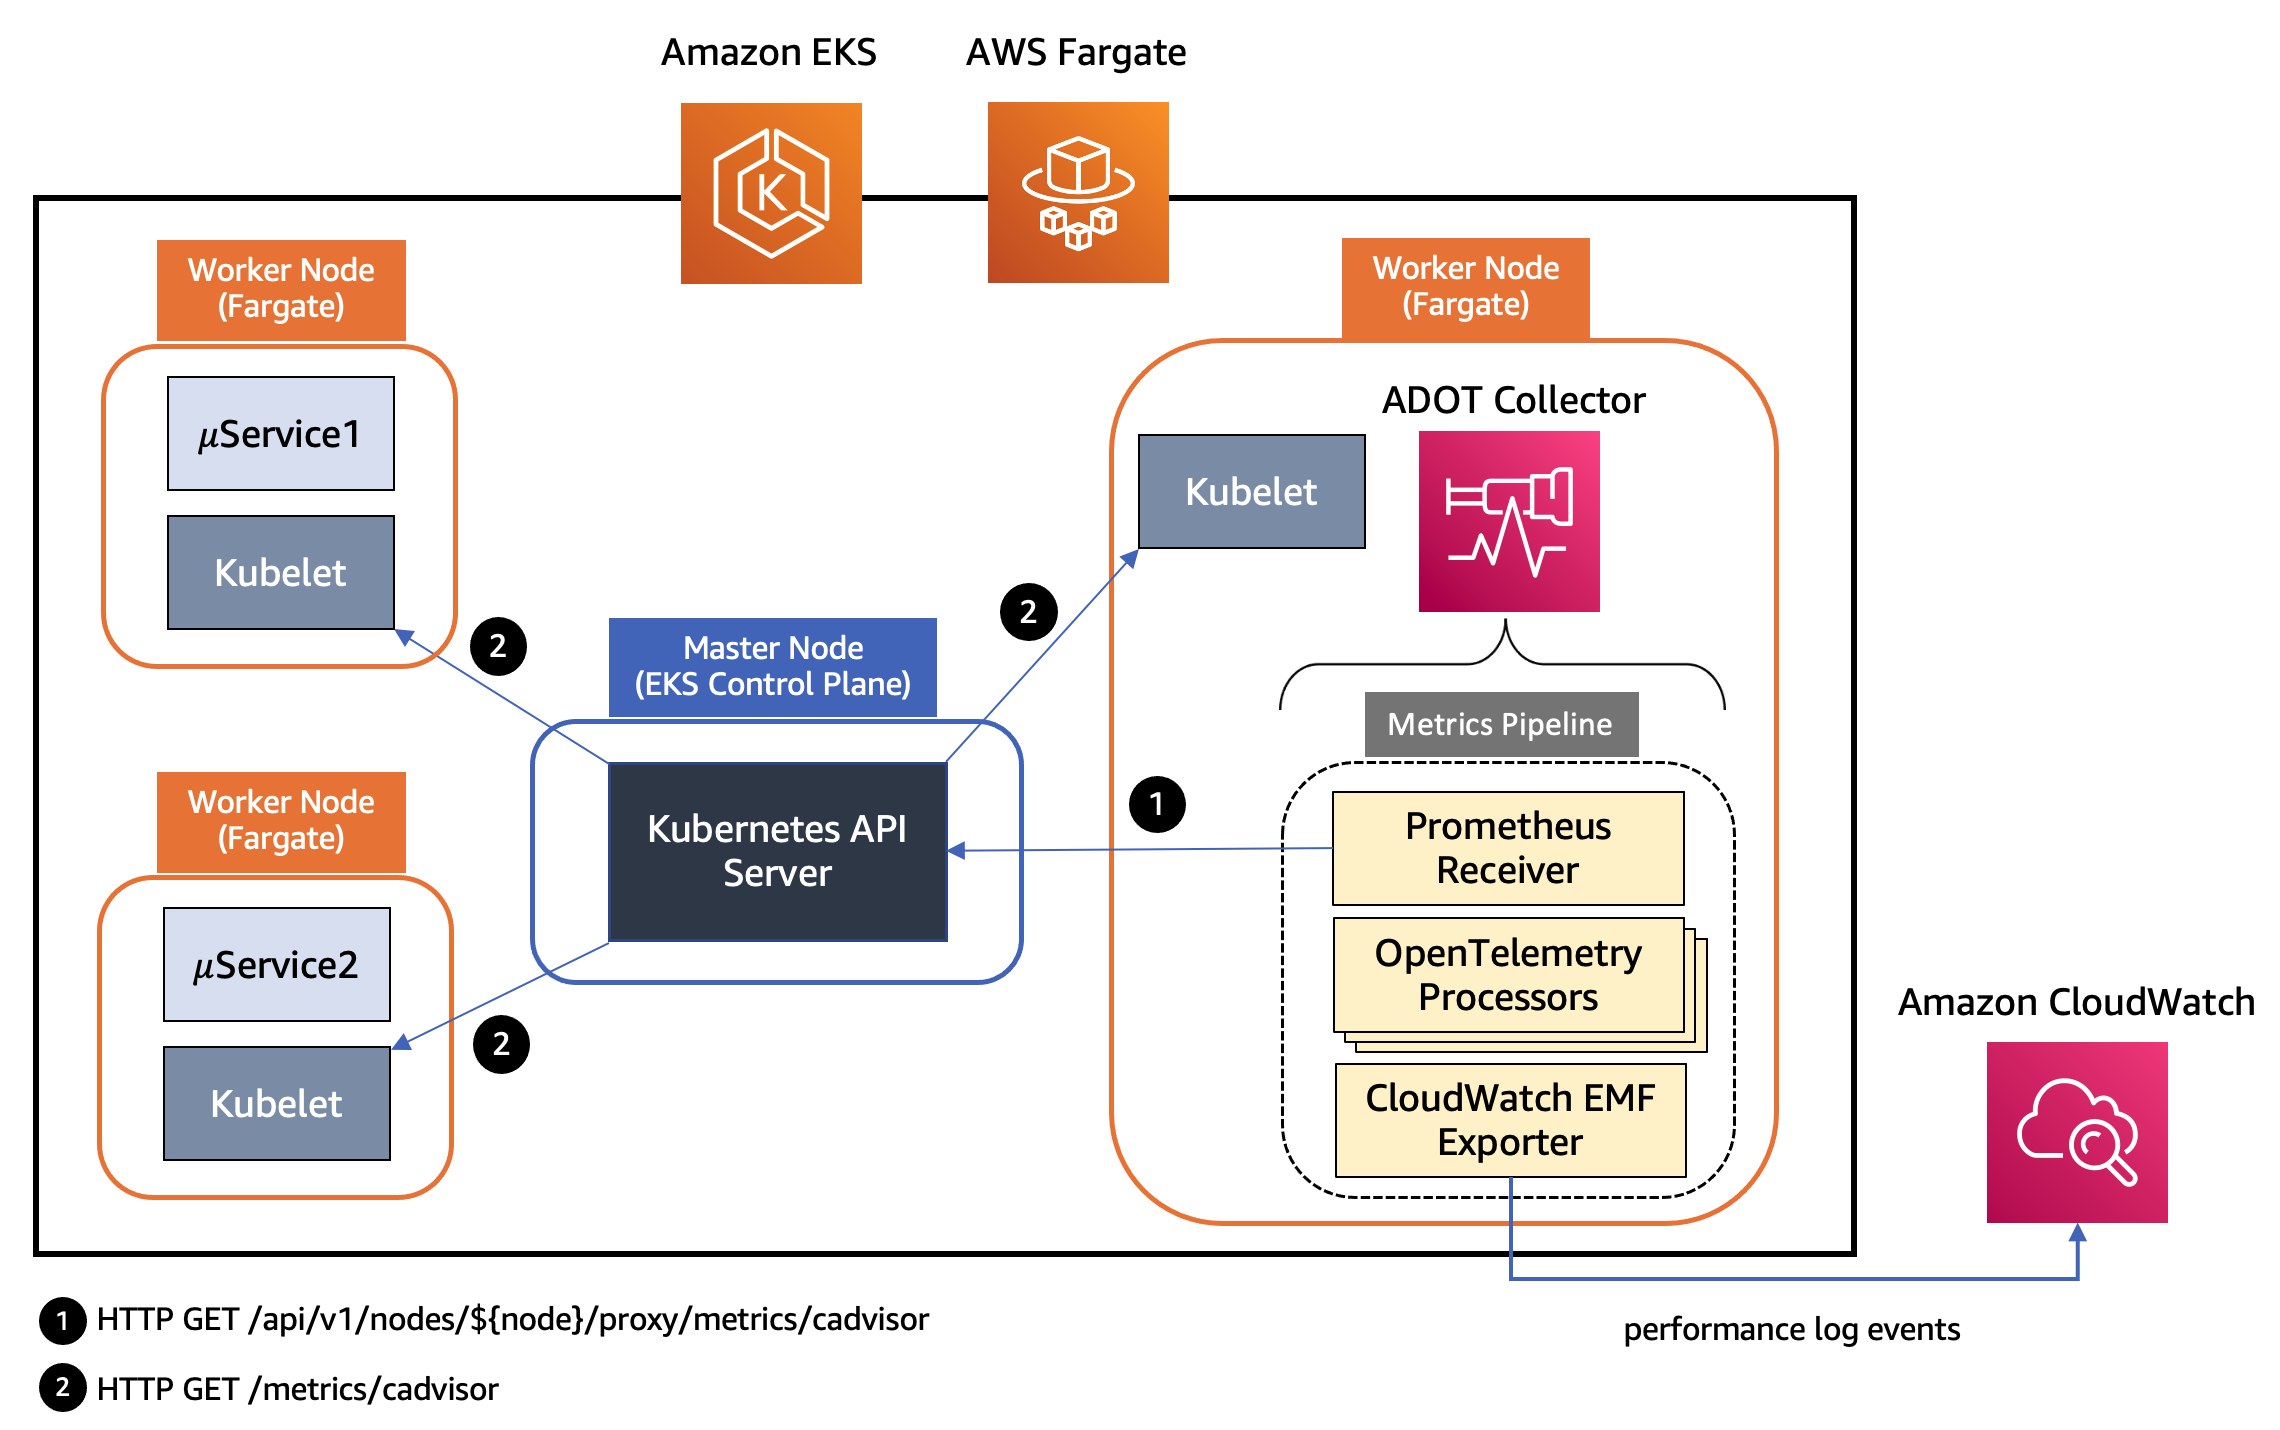
The kubelet on a worker node in a Kubernetes cluster exposes resource metrics such as CPU, memory, disk, and network usage at the /metrics/cadvisor endpoint. However, in EKS Fargate networking architecture, a pod is not allowed to directly reach the kubelet on that worker node. Hence, the ADOT Collector calls the Kubernetes API Server to proxy the connection to the kubelet on a worker node, and collect kubelet’s cAdvisor metrics for workloads on that node. These metrics are made available in Prometheus format. Therefore, the collector uses an instance of Prometheus Receiver as a drop-in replacement for a Prometheus server and scrapes these metrics from the Kubernetes API server endpoint. Using Kubernetes service discovery, the receiver can discover the worker nodes in an EKS cluster based on the role configured to discover targets, see here: kubernetes_sd_configs. Hence, a single collector is able to discover all worker nodes in an EKS cluster.
The metrics then go through a series of processors that perform filtering, renaming, data aggregation and conversion etc. The following is the list of processors used in the pipeline of an ADOT Collector instance for EKS Fargate illustrated above.
- Filter Processor to include or exclude metrics based on their name
- Metrics Transform Processor to rename metrics as well as perform aggregations on metrics across labels
- Cumulative to Delta Processor to convert cumulative sum metrics to delta sums.
- Delta to Rate Processor to convert delta sum metrics to rate metrics. This rate is a gauge.
- Metrics Generation Processor to create new metrics using existing metrics
The final component in the pipeline is AWS CloudWatch EMF Exporter which converts the metrics to embedded metric format (EMF) and then sends them directly to CloudWatch Logs using the PutLogEvents API.
The following list of pod metrics is sent to CloudWatch by the ADOT Collector for each of the workloads running on EKS Fargate. Other data points will still be sent to CloudWatch as raw CloudWatch logs but not in Metric format.
- pod_cpu_utilization_over_pod_limit
- pod_cpu_usage_total
- pod_cpu_limit
- pod_memory_utilization_over_pod_limit
- pod_memory_working_set
- pod_memory_limit
- pod_network_rx_bytes
- pod_network_tx_bytes
Each metric will be associated with the following three dimension sets and collected under the CloudWatch namespace named ContainerInsights.
- ClusterName, LaunchType
- ClusterName, Namespace, LaunchType
- ClusterName, Namespace, PodName, LaunchType
Deploying ADOT Collector to EKS Fargate
Let’s get into the details of deploying the ADOT Collector in an EKS Fargate cluster and then collecting metrics data from workloads.
- List of pre-requisites for deploying the ADOT Collector.
- An EKS cluster that supports Kubernetes version 1.21 or higher. You may create the EKS cluster using one of the approaches outlined here.
- When your cluster creates pods on AWS Fargate, the components that run on the Fargate infrastructure must make calls to AWS APIs on your behalf. This is so that they can execute actions such as pull container images from Amazon ECR. The EKS pod execution role provides the IAM permissions to do this. Create a Fargate pod execution role as outlined here.
- Before you can schedule pods running on Fargate, you must define a Fargate profile that specifies which pods should use Fargate when they are launched. For the sample deployments used here, we create two Fargate profiles as outlined here. The first Fargate profile is named fargate-container-insights, specifying the namespace fargate-container-insights. The second one is named applications, specifying the namespace golang.
- The ADOT Collector requires IAM permissions to send performance log events to CloudWatch. This is done by associating a Kubernetes service account with an IAM role using the IAM Roles for Service Accounts (IRSA) feature supported by EKS. The IAM role should be associated with the AWS managed policy
CloudWatchAgentServerPolicy. The helper script shown below may be used, after substituting the CLUSTER_NAME and REGION variables, to create an IAM role namedEKS-ADOT-ServiceAccount-Rolethat is granted these permissions and is associated with a Kubernetes service account namedadot-collector.
##!/bin/bashCLUSTER_NAME=YOUR-EKS-CLUSTER-NAMEREGION=YOUR-EKS-CLUSTER-REGIONSERVICE_ACCOUNT_NAMESPACE=fargate-container-insightsSERVICE_ACCOUNT_NAME=adot-collectorSERVICE_ACCOUNT_IAM_ROLE=EKS-Fargate-ADOT-ServiceAccount-RoleSERVICE_ACCOUNT_IAM_POLICY=arn:aws:iam::aws:policy/CloudWatchAgentServerPolicy
eksctl utils associate-iam-oidc-provider \--cluster=$CLUSTER_NAME \--approve
eksctl create iamserviceaccount \--cluster=$CLUSTER_NAME \--region=$REGION \--name=$SERVICE_ACCOUNT_NAME \--namespace=$SERVICE_ACCOUNT_NAMESPACE \--role-name=$SERVICE_ACCOUNT_IAM_ROLE \--attach-policy-arn=$SERVICE_ACCOUNT_IAM_POLICY \--approveDeploy the ADOT Collector as a Kubernetes StatefulSet using the eks-fargate-container-insights.yaml after replacing the placeholder variable
YOUR-EKS-CLUSTER-NAMEin the manifest with the name of your EKS cluster and replacingregion=us-east-1in theemfexporterif you are not usingus-east-1region.Deploy a sample stateless workload to the cluster with the following deployment manifest.
---apiVersion: apps/v1kind: Deploymentmetadata: name: webapp namespace: golangspec: replicas: 2 selector: matchLabels: app: webapp role: webapp-service template: metadata: labels: app: webapp role: webapp-service annotations: prometheus.io/scrape: 'true' prometheus.io/port: '3000' prometheus.io/path: '/metrics' spec: containers: - name: go image: public.ecr.aws/awsvijisarathy/prometheus-webapp:latest imagePullPolicy: Always resources: requests: cpu: "256m" memory: "512Mi" limits: cpu: "512m" memory: "1024Mi"- The above deployments are both targeting a namespace associated with a Fargate profile and hence the workloads will be scheduled to run on Fargate. It may take a couple of minutes for a Fargate worker node to be provisioned for each of these workloads and for the pods to reach a Ready status. Executing the command
kubectl get nodes -l eks.amazonaws.com/compute-type=fargateshould now list the Fargate worker nodes named with the prefix fargate. Verify that the ADOT Collector and the workload pods are all running using the following commands:
kubectl get pods -n fargate-container-insightskubectl get pods -n golangVisualizing EKS Fargate resource metrics using CloudWatch Container Insights
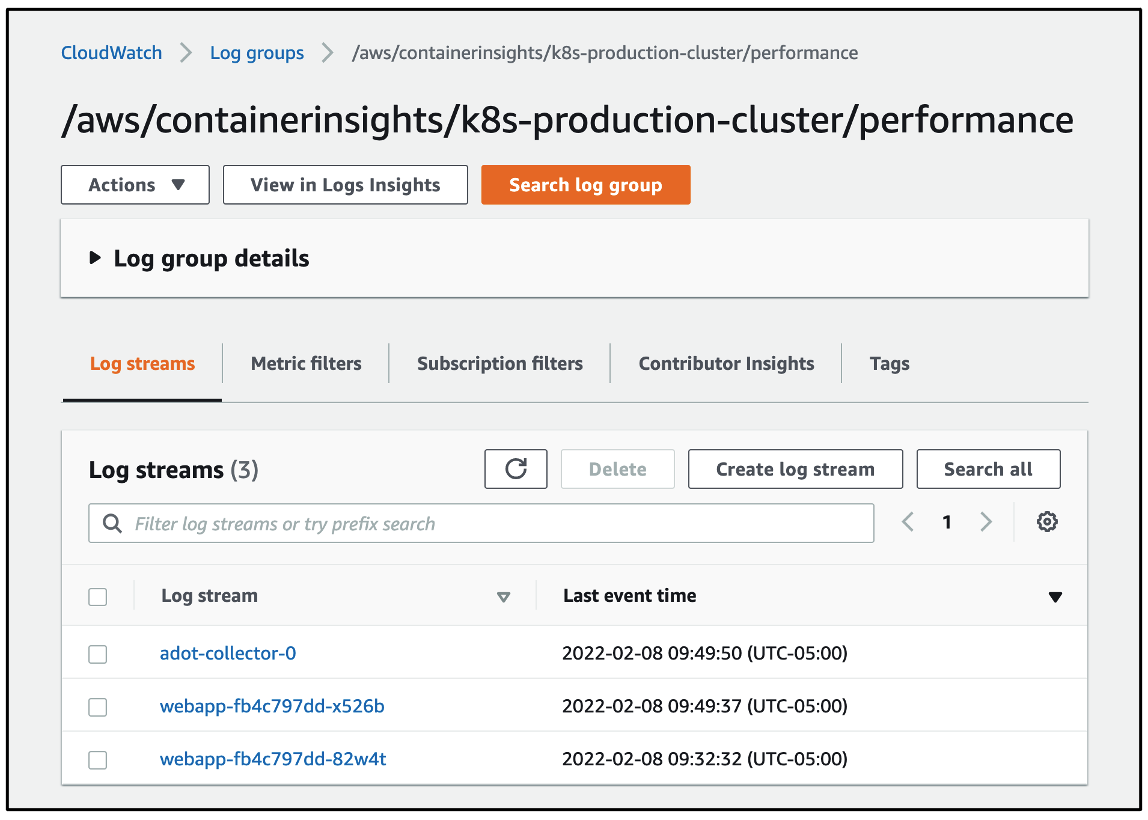
The performance log events for the workloads will be found under the log group named
/aws/containerinsights/CLUSTER_NAME/performance as shown below. A separate log stream is created for each pod running on Fargate.
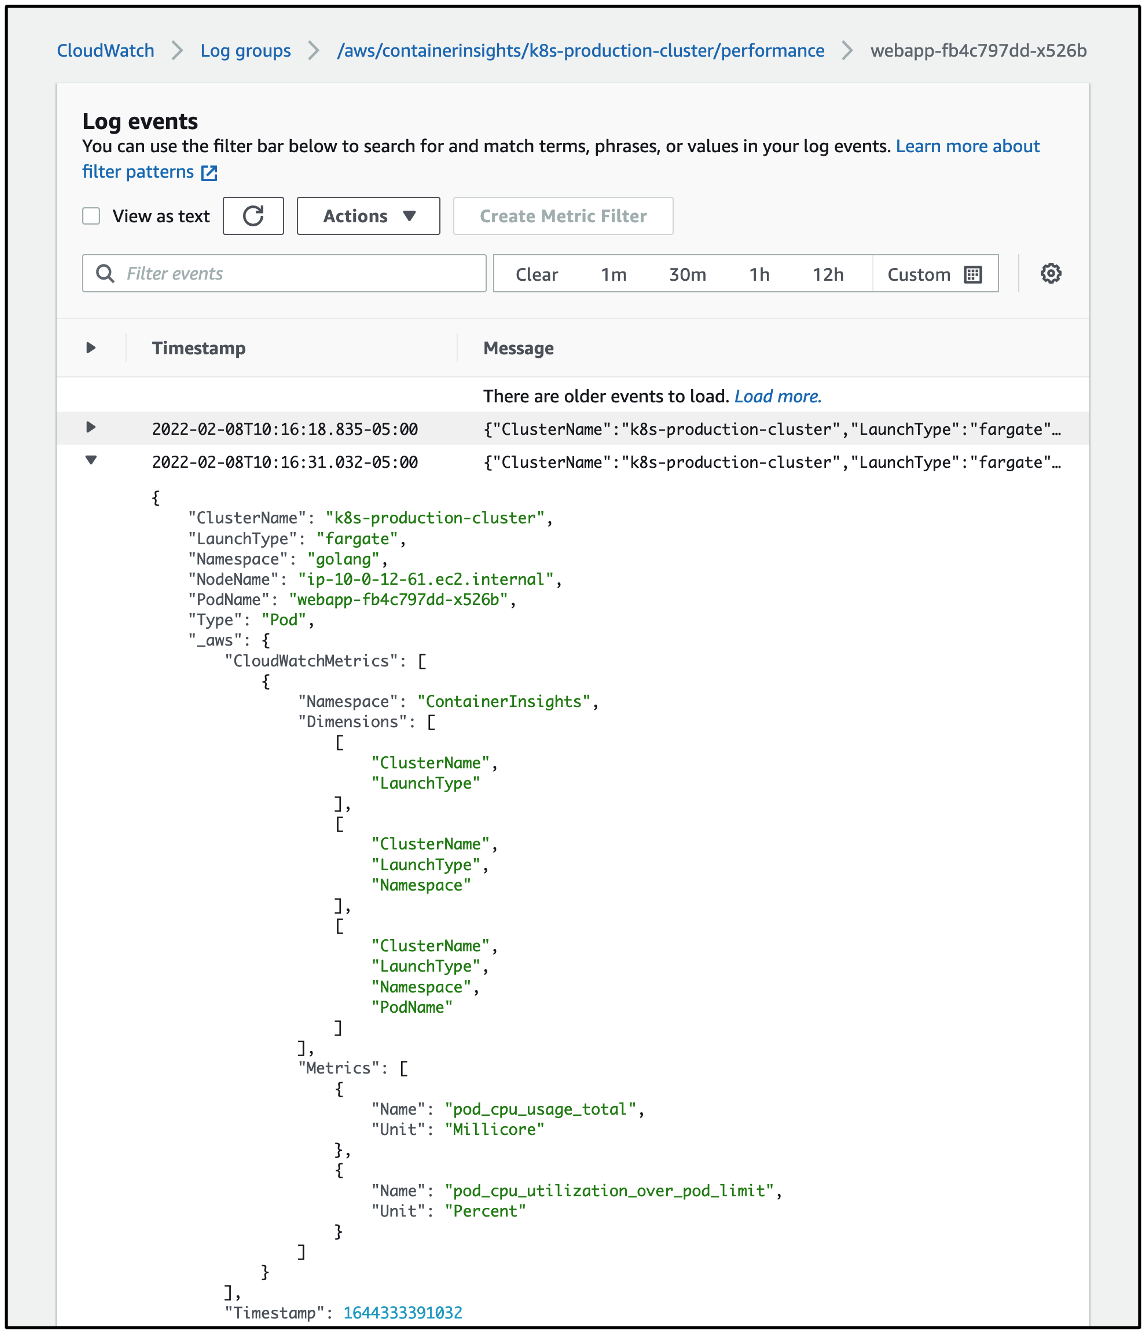
Shown below is a representative example of the JSON data with embedded metric format contained in one of the log events that identifies the data as pertaining to the metrics named pod_cpu_usage_total and pod_cpu_utilization_over_pod_limit.
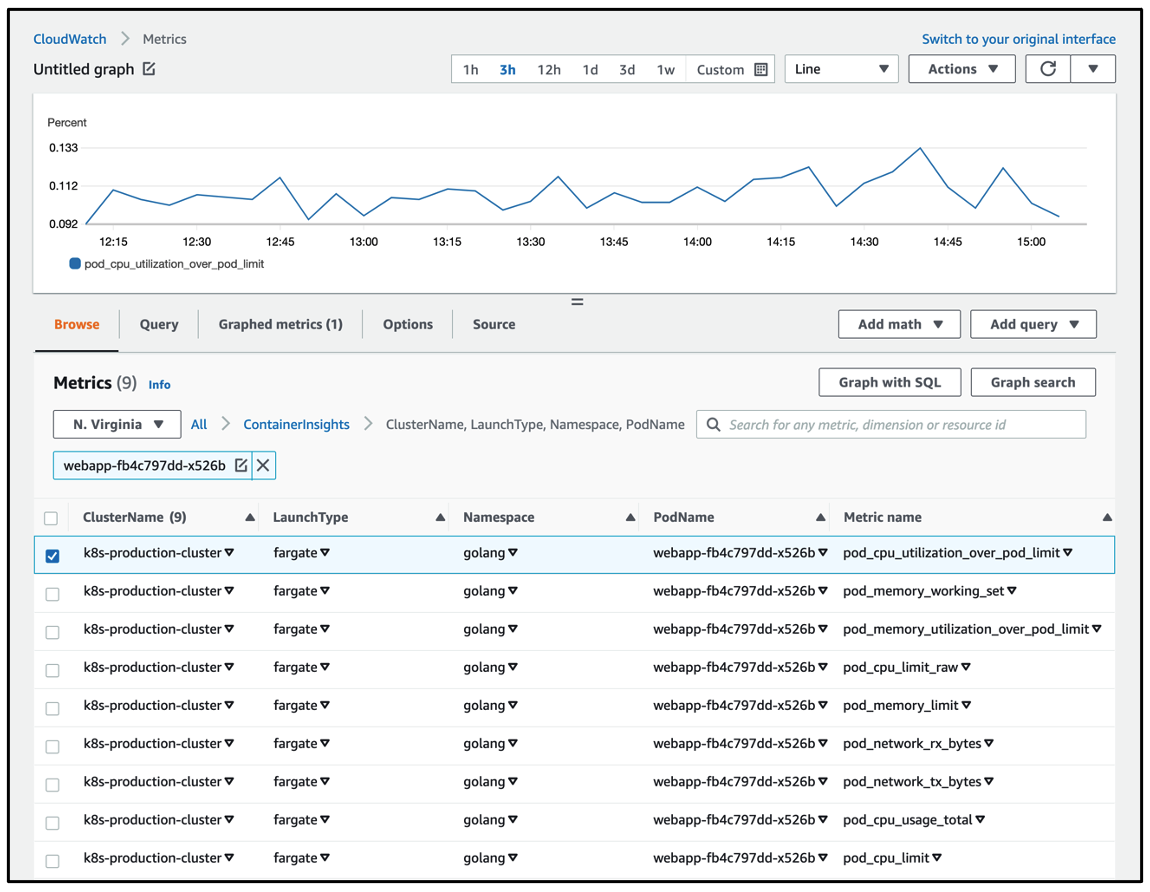
Shown below is a graph of the same metric pod_cpu_utilization_over_pod_limit seen in the CloudWatch metrics dashboard.
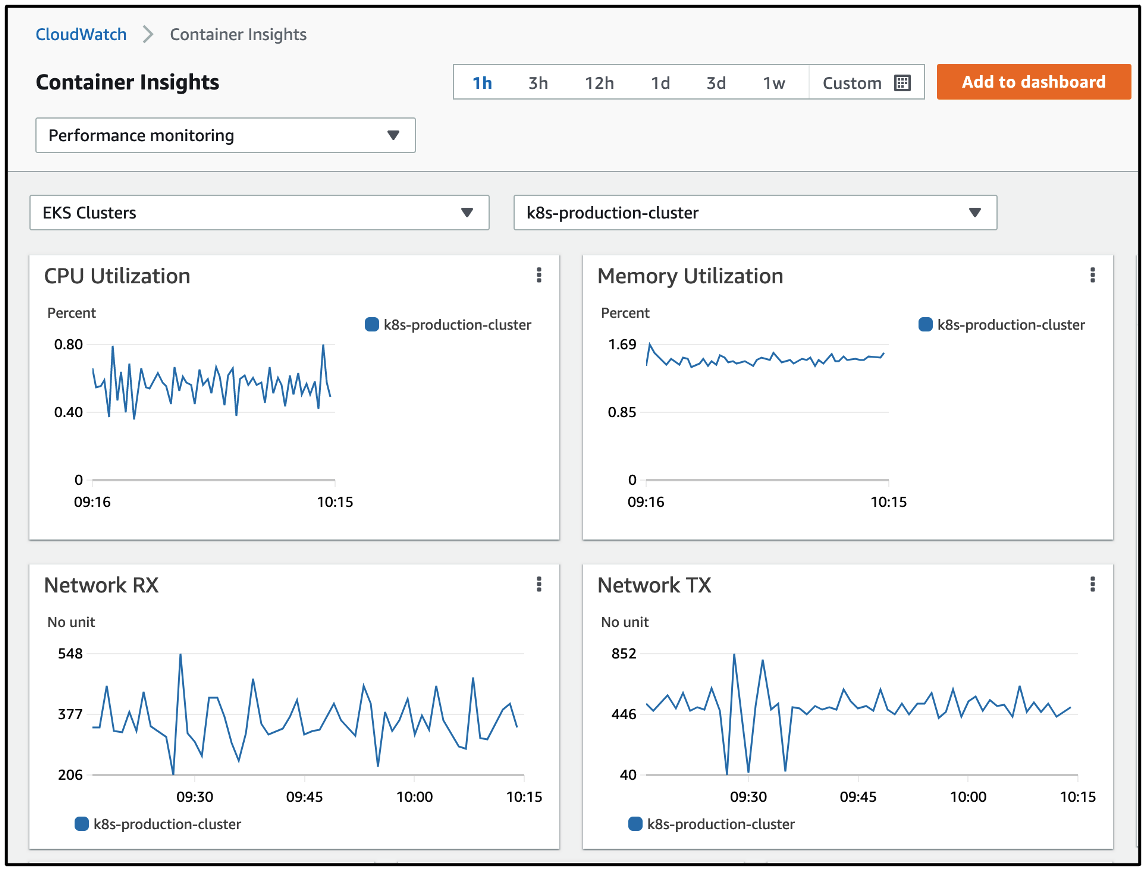
The metrics may also be visualized using the prebuilt Container Insights dashboards that display data at the cluster, node, namespace, service and pod level. Shown below is a view of the dashboard displaying EKS Fargate metrics at the cluster level.