AWS Distro for OpenTelemetry
Container Insights EKS Infrastructure Metrics
Container Insights EKS Infrastructure Metrics
In this tutorial, we will walk through how to enable CloudWatch Container Insights infrastructure metrics with ADOT Collector for an EKS EC2 cluster.
Getting Started
To use the ADOT Collector to collect infrastructure metrics for a service cluster, we need to make sure all the prerequisites are satisfied.
Then we can deploy the ADOT Collector as a daemon set to the cluster by entering the following command:
curl https://raw.githubusercontent.com/aws-observability/aws-otel-collector/main/deployment-template/eks/otel-container-insights-infra.yaml |kubectl apply -f -You can run the following command to confirm that the ADOT Collector is running:
kubectl get pods -l name=aws-otel-eks-ci -n aws-otel-eksIf the results include multiple pods (one for each cluster node) in the Running state, the Collector is running and collecting metrics from the cluster.
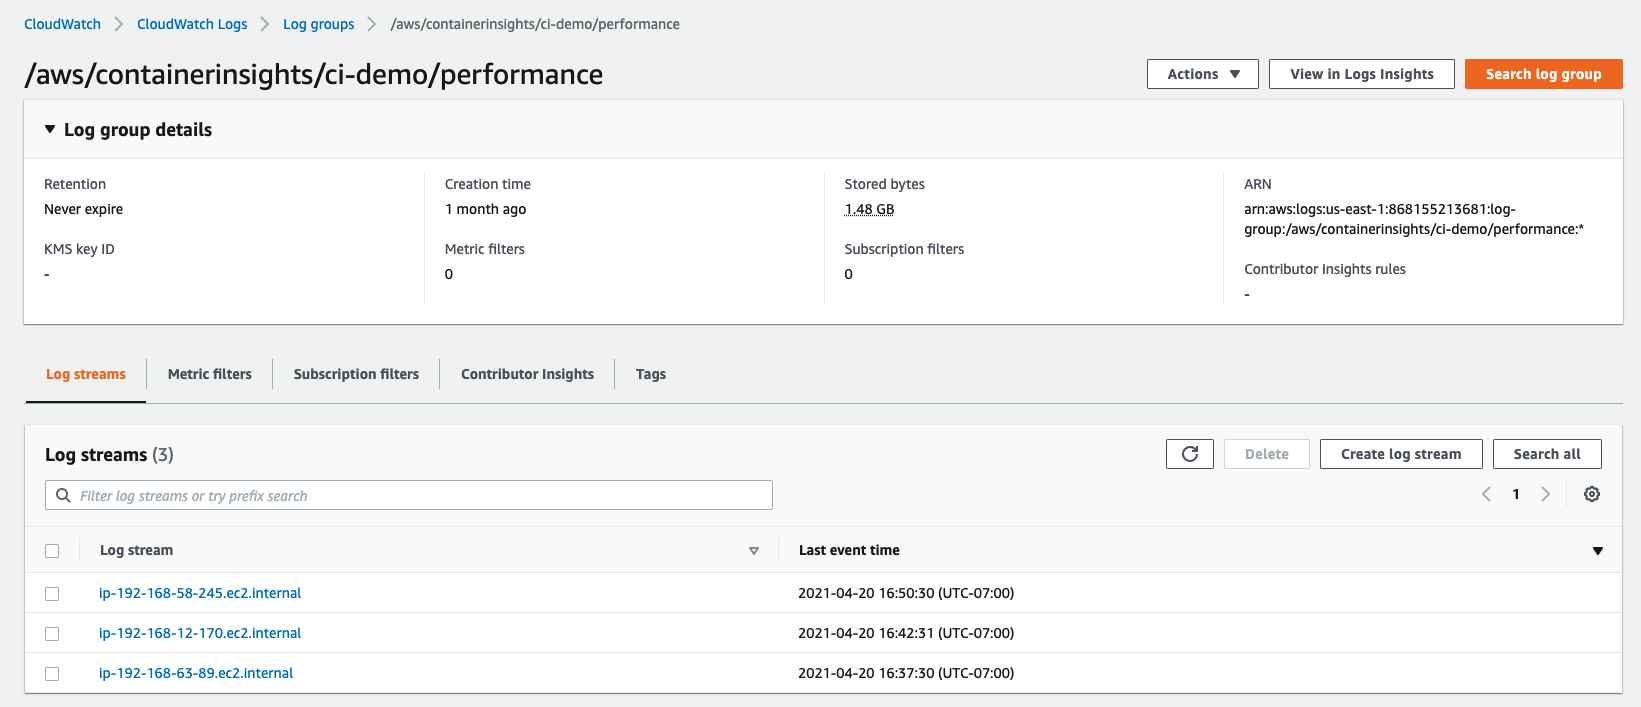
The ADOT Collector creates a log group named /aws/containerinsights/{your-cluster}/performance and sends the performance log events to this log group.
Each collector pod on a cluster node will publish logs to a log stream with the name of the cluster node. In the screenshot, three log streams are present
under the log group /aws/containerinsights/ci-demo/performance and each corresponds to one cluster node:
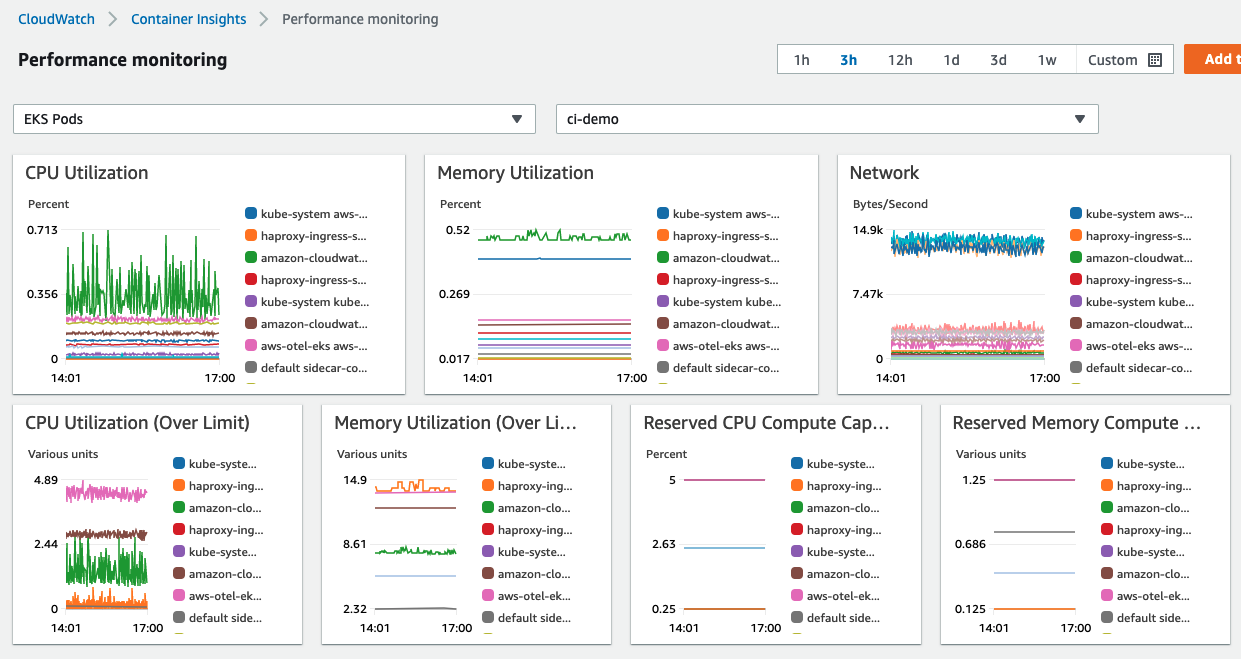
The metrics that Container Insights collects are also available in CloudWatch automatic dashboards as different resource types, such as
EKS Clusters, EKS Namespaces, EKS Nodes, EKS Services, and EKS Pods. Here is a screenshot for the pod level metrics for
a cluster named ci-demo:
Default configuration to support CloudWatch Container Insights for EKS EC2
The yaml file used in previous deployment contains the default configuration for ADOT Collector to enable CloudWatch Container Insights for EKS. The default configuration includes the essential components for collecting infrastructure metric in EKS cluster.
receivers: awscontainerinsightreceiver:processors: batch/metrics: timeout: 60sexporters: awsemf: namespace: ContainerInsights log_group_name: '/aws/containerinsights/{ClusterName}/performance' log_stream_name: '{NodeName}' resource_to_telemetry_conversion: enabled: true dimension_rollup_option: NoDimensionRollup parse_json_encoded_attr_values: [Sources, kubernetes] metric_declarations: # node metrics - dimensions: [[NodeName, InstanceId, ClusterName]] metric_name_selectors: - node_cpu_utilization - node_memory_utilization - node_network_total_bytes - node_cpu_reserved_capacity - node_memory_reserved_capacity - node_number_of_running_pods - node_number_of_running_containers - dimensions: [[ClusterName]] metric_name_selectors: - node_cpu_utilization - node_memory_utilization - node_network_total_bytes - node_cpu_reserved_capacity - node_memory_reserved_capacity - node_number_of_running_pods - node_number_of_running_containers - node_cpu_usage_total - node_cpu_limit - node_memory_working_set - node_memory_limit # pod metrics - dimensions: [[PodName, Namespace, ClusterName], [Service, Namespace, ClusterName], [Namespace, ClusterName], [ClusterName]] metric_name_selectors: - pod_cpu_utilization - pod_memory_utilization - pod_network_rx_bytes - pod_network_tx_bytes - pod_cpu_utilization_over_pod_limit - pod_memory_utilization_over_pod_limit - dimensions: [[PodName, Namespace, ClusterName], [ClusterName]] metric_name_selectors: - pod_cpu_reserved_capacity - pod_memory_reserved_capacity - dimensions: [[PodName, Namespace, ClusterName]] metric_name_selectors: - pod_number_of_container_restarts # cluster metrics - dimensions: [[ClusterName]] metric_name_selectors: - cluster_node_count - cluster_failed_node_count # service metrics - dimensions: [[Service, Namespace, ClusterName], [ClusterName]] metric_name_selectors: - service_number_of_running_pods # node fs metrics - dimensions: [[NodeName, InstanceId, ClusterName], [ClusterName]] metric_name_selectors: - node_filesystem_utilization # namespace metrics - dimensions: [[Namespace, ClusterName], [ClusterName]] metric_name_selectors: - namespace_number_of_running_podsservice: pipelines: metrics: receivers: [awscontainerinsightreceiver] processors: [batch/metrics] exporters: [awsemf]Receiver
The receiver awscontainerinsightreceiver is a component introduced for Container Insights support. It collects metrics from an embedded cadvisor lib and
kubernetes api server. The default metric collection interval is 60 seconds.
Processor
The processor batch/metrics is used to batch the metrics before sending them to the AWS embedded metric format exporter. This reduces the number of requests that the
exporter needs to publish the metrics.
Exporter
The exporter awsemf is used to sent the metrics to the CloudWatch backend in the form of EMF logs. In the configuration for awsemf exporter, the two
placeholders {ClusterName} and {NodeName} in the log group and log stream names are replaced dynamically with the names of the cluster
and the node on which the ADOT Collector is running. In the metric_declarations section, different types of exported metrics are specified. The current setting
supports the automatic dashboards for Container Insights. Customers can add new entries in metric_declarations section to export other metrics,
or change the dimensions to generate different sets of metrics using the same metric_name_selectors.
Advanced usage
With the default configuration, the ADOT Collector collects the complete set of metrics as defined in this AWS public document. To reduce the AWS cost for the CloudWatch metrics and embedded metric format logs generated by Container Insights, you can customize the ADOT Collector using the following two methods.
Filter out embedded metric format logs with third-party processors
This involves the introduction of other third-party processors to filter out metrics or attributes to reduce the size of embedded metric format logs. In the following, we demonstrate the basic use of two processors. For more complicated use cases, you can refer to their readme files for details.
- Filter Processor can be used to filter out unwanted metrics.
For example, suppose you want all the node-level metrics (with name prefix
node_) except those for disk io and filesystem (with name prefixnode_diskioandnode_filesystem). You can add the filter processor into the pipeline like the following:
receivers: awscontainerinsightreceiver:
processors: filter/include: # any names NOT matching filters are excluded from remainder of pipeline metrics: include: match_type: regexp metric_names: # re2 regexp patterns - ^node_.* filter/exclude: # any names matching filters are excluded from remainder of pipeline metrics: exclude: match_type: regexp metric_names: - ^node_diskio_.* - ^node_filesystem_.* batch/metrics: timeout: 60s
exporters: awsemf: ... ...
service: pipelines: metrics: receivers: [awscontainerinsightreceiver] processors: [filter/include, filter/exclude, batch/metrics] exporters: [awsemf]- Resource Processor can be used to remove unwanted attributes.
For example, if you want to remove the
kubernetesandSourcesfields from the embedded metric format logs, you can add the resource processor to the pipeline like the following:
receivers: awscontainerinsightreceiver:
processors: resource: attributes: - key: Sources action: delete - key: kubernetes action: delete batch/metrics: timeout: 60s
exporters: awsemf: ... ...
service: pipelines: metrics: receivers: [awscontainerinsightreceiver] processors: [resource, batch/metrics] exporters: [awsemf]Configure metrics sent by CloudWatch embedded metric format exporter
The metric_declaration section of CloudWatch embedded metric format exporter configuration characterizes the rules to generate metrics from embedded metric format logs. You can customize the section to generate only the metrics that you want.
For example, you can keep only pod metrics from the default configuration. This metric_declaration section will look like the following:
metric_declarations: # pod metrics - dimensions: [[PodName, Namespace, ClusterName], [Service, Namespace, ClusterName], [Namespace, ClusterName], [ClusterName]] metric_name_selectors: - pod_cpu_utilization - pod_memory_utilization - pod_network_rx_bytes - pod_network_tx_bytes - pod_cpu_utilization_over_pod_limit - pod_memory_utilization_over_pod_limitTo reduce the number of metrics, you can keep only the dimension set [Service, Namespace, ClusterName] if you don't care about others:
metric_declarations: # pod metrics - dimensions: [[Service, Namespace, ClusterName]] metric_name_selectors: - pod_cpu_utilization - pod_memory_utilization - pod_network_rx_bytes - pod_network_tx_bytes - pod_cpu_utilization_over_pod_limit - pod_memory_utilization_over_pod_limitIn addition, you might want to ignore the pod network metrics, you can delete the metrics pod_network_rx_bytes and pod_network_tx_bytes.
Suppose you are interested in the dimension PodName, you can add it to the dimension set [Service, Namespace, ClusterName].
With the above customizations, the final metric_declarations will become:
metric_declarations: # pod metrics - dimensions: [[PodName, Namespace, Service]] metric_name_selectors: - pod_cpu_utilization - pod_memory_utilization - pod_cpu_utilization_over_pod_limit - pod_memory_utilization_over_pod_limitThis configuration will produce only 4 metrics (rather than 55 metrics as in the default configuration).
Note: When using the containerd runtime for Amazon EKS or Kubernetes, the Container Filesystem (ContainerFS) metrics are currently not available. This is a known issue and we're working on it, see also Disk usage metric for containerd.