AWS Distro for OpenTelemetry
Container Insights EKS Prometheus
Container Insights EKS Prometheus
This section explains how to set up Prometheus monitoring with the ADOT Collector in a cluster running Amazon EKS or Kubernetes. With default configurations, the ADOT Collector automatically scrapes and imports metrics for the following workloads running in a cluster.
To deploy these sample workloads, please follow the above links for guidance.
Set Up IAM Policy
To use the ADOT Collector to collect Prometheus metrics, make sure the following policies are attached to your node instance role.
AmazonEKSWorkerNodePolicyAmazonEKS_CNI_PolicyAmazonEC2ContainerRegistryReadOnlyCloudWatchAgentServerPolicyAmazonSSMManagedInstanceCoreAWSXrayWriteOnlyAccessAWSXRayDaemonWriteAccessAmazonS3ReadOnlyAccessAmazonPrometheusFullAccessDeploy the ADOT Collector with default configuration
The default all-in-one configuration is built into the image of ADOT Collector and can be used to collect Prometheus metrics for all the sample workloads.
- Set up variables to export metrics of your EKS cluster to the region where the logs should be published to.
export CLUSTER_NAME=<eks-cluster-name>export AWS_REGION=<aws-region>Download the example deployment file otel-container-insights-prometheus.yaml.
Deploy it to the cluster.
cat otel-container-insights-prometheus.yaml |sed "s/{{region}}/$AWS_REGION/g" |sed "s/{{cluster_name}}/$CLUSTER_NAME/g" |kubectl apply -f -Check the resources in the
aws-otel-eksnamespace.- Make sure Pods are running.
kubectl get all -naws-otel-eks- You should be able to see the message
Everything is ready. Begin running and processing databy fetching logs from the Pod if the ADOT Collector is started correctly.
kubectl logs -naws-otel-eks $POD_NAME
Customize the ADOT Collector
To collect Prometheus metrics that are different from those specified in the default configuration, you can configure ADOT Collector with your own configuration.
Prepare Customized Configuration
In general, the
processorssection should be the same as what is shown below.processors:resourcedetection/ec2:detectors: [ env ]timeout: 2soverride: falseresource:attributes:- key: TaskIdfrom_attribute: jobaction: insert- key: receivervalue: "prometheus"action: insertresourcedetection/ec2is a processor that reads environment variables and converts them to resource attributes. In the example of otel-container-insights-prometheus.yaml, it injectsClusterNamewhich is later used by awsemf exporter to generatelog_group_name.resourceis a processor that injects additional resource attributes. We copy the value fromjobtoTaskIdto generatelog_stream_name. The attributereceiver: prometheusis an identifier for optimizing Prometheus metrics before awsemf exporter sending metric logs to CloudWatch.
Create ConfigMap
otel-configin theaws-otel-eksnamespace with your customized configuration so that it can be consumed by aws-otel-collector Pods.Be sure to rename
{{filename}}with the actual filename.kubectl create configmap otel-config --from-file={{filename}} -naws-otel-eks
Run ADOT Collector
Edit otel-container-insights-prometheus.yaml with the following changes:
Add volume
otel-config.apiVersion: apps/v1kind: Deploymentmetadata:...spec:replicas: 1...template:spec:containers:...volumes:- configMap:defaultMode: 420name: otel-configname: otel-configMount volume to the container and define command and arguments.
Make sure that
{{filename}}matches the key in theotel-configConfigMap.apiVersion: apps/v1kind: Deploymentmetadata:...spec:replicas: 1...template:spec:containers:- name: aws-otel-collectorcommand: ["/awscollector"]args: [ "--config", "/etc/otel/{{filename}}"]...volumeMounts:- mountPath: /etc/otel/name: otel-configreadOnly: truevolumes:- configMap:defaultMode: 420name: otel-configname: otel-configFinally roll out the updated deployment to the EKS cluster.
cat otel-container-insights-prometheus.yaml |sed "s/{{region}}/$AWS_REGION/g" |sed "s/{{cluster_name}}/$CLUSTER_NAME/g" |kubectl apply -f -
View Your Data
View your Container Insights auto-dashboard
Open the CloudWatch console. In the AWS Region where your cluster is running, choose
Container Insights - Performance monitoringin the navigation panel. Then selectEKS Prometheus {{workload_type}}and{{cluster_name}}from the drop down menu in the main panel.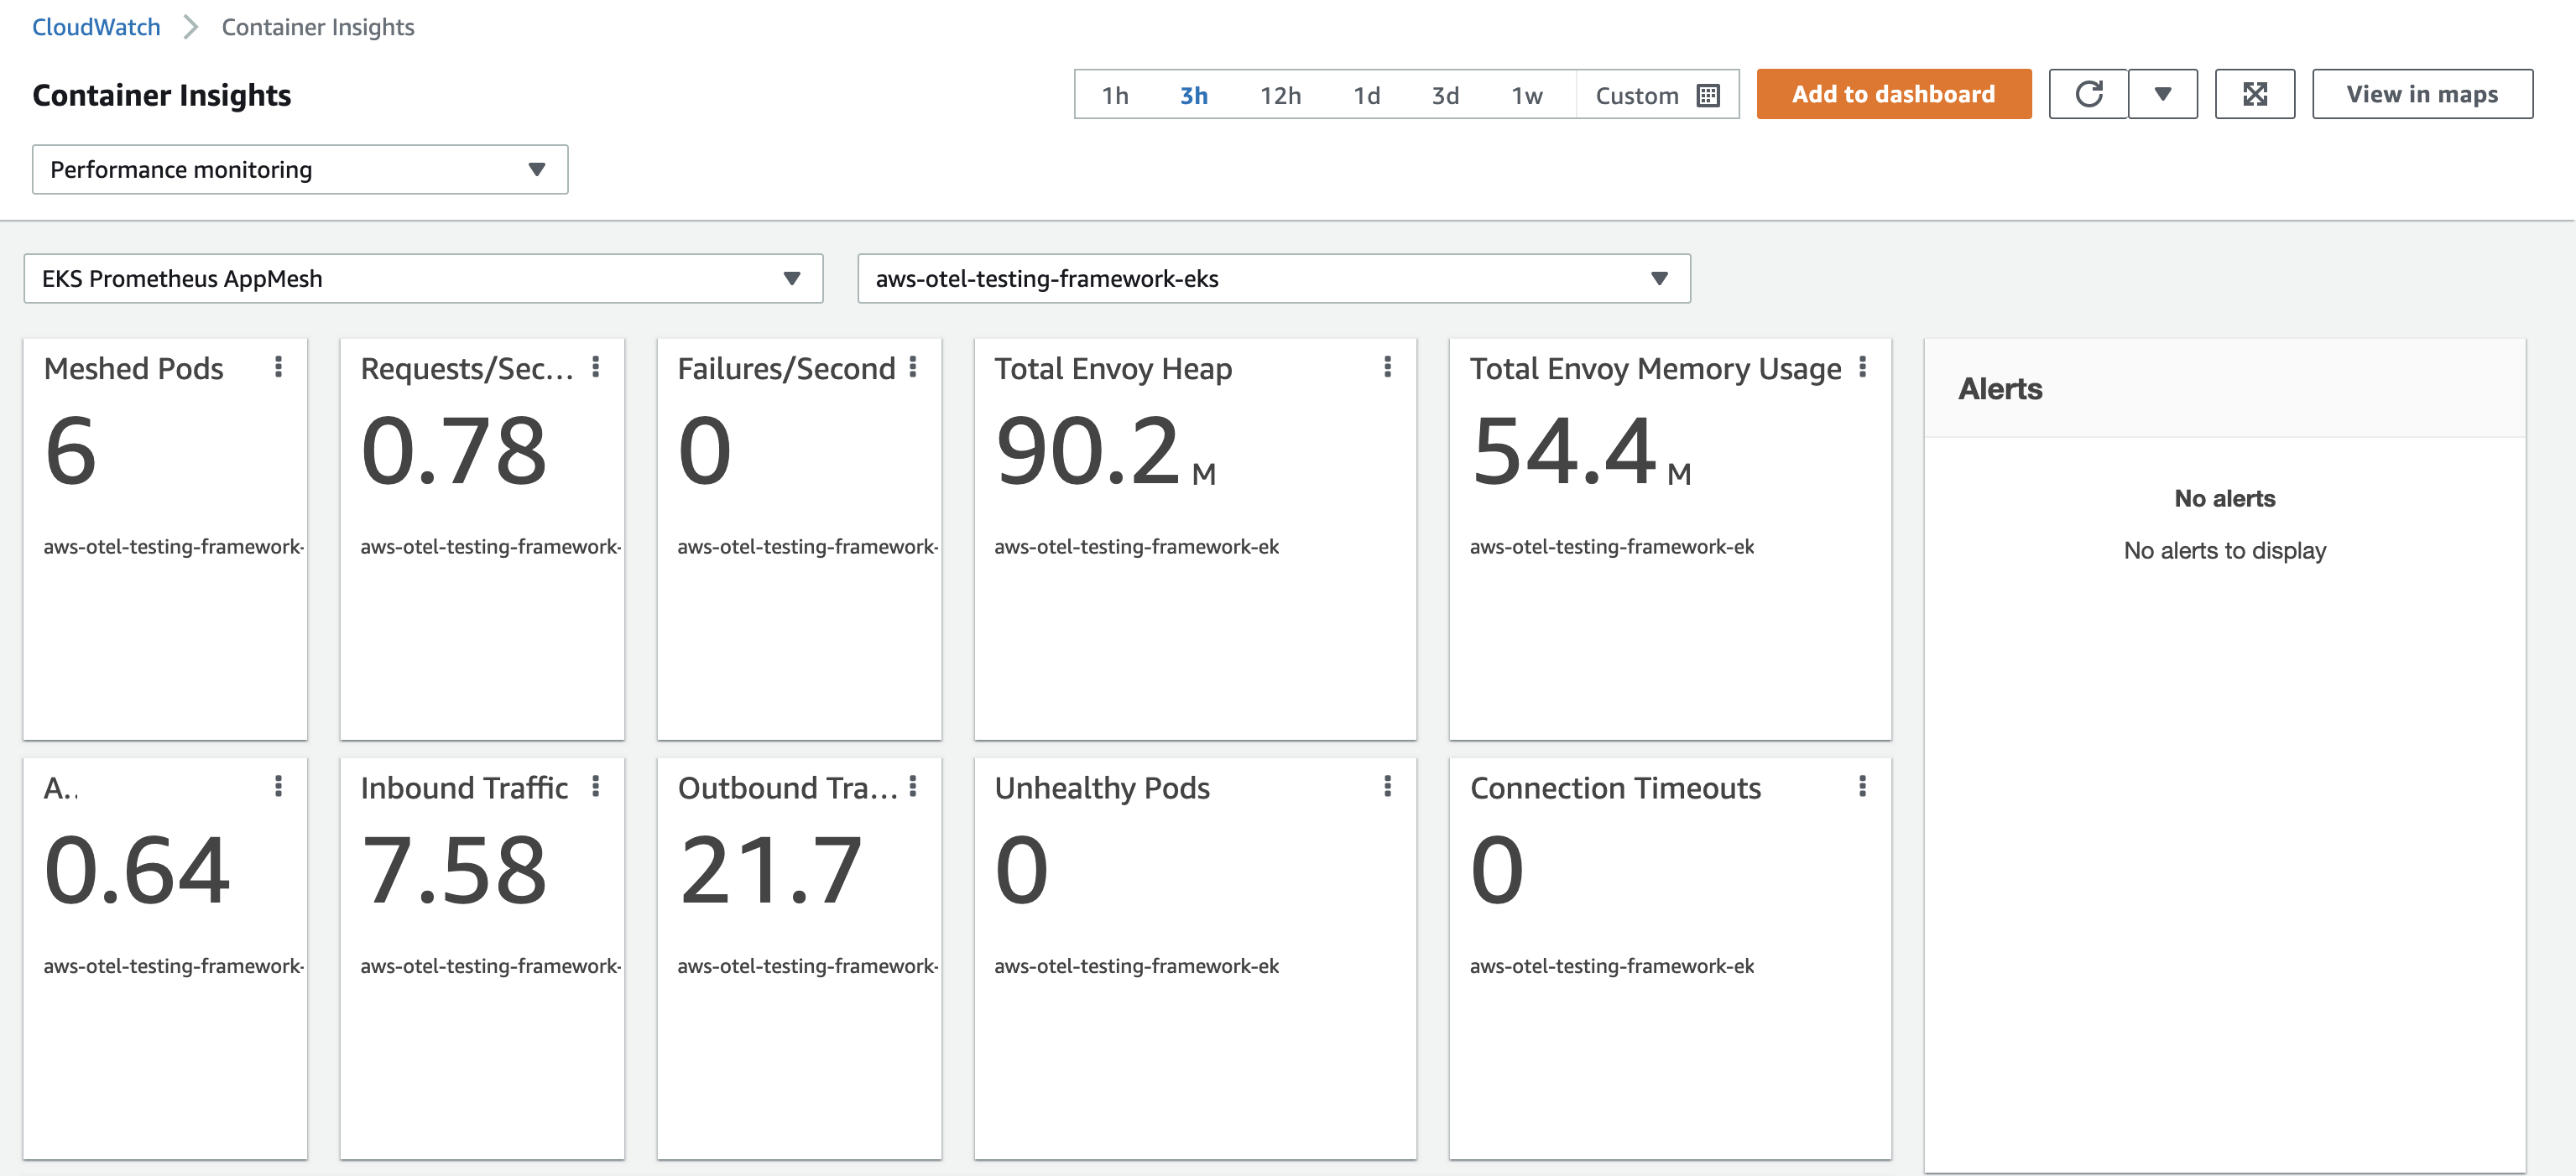
View Your Metrics
To see the CloudWatch metrics, choose Metrics in the navigation panel. The metric are in the
ContainerInsights/Prometheusnamespace.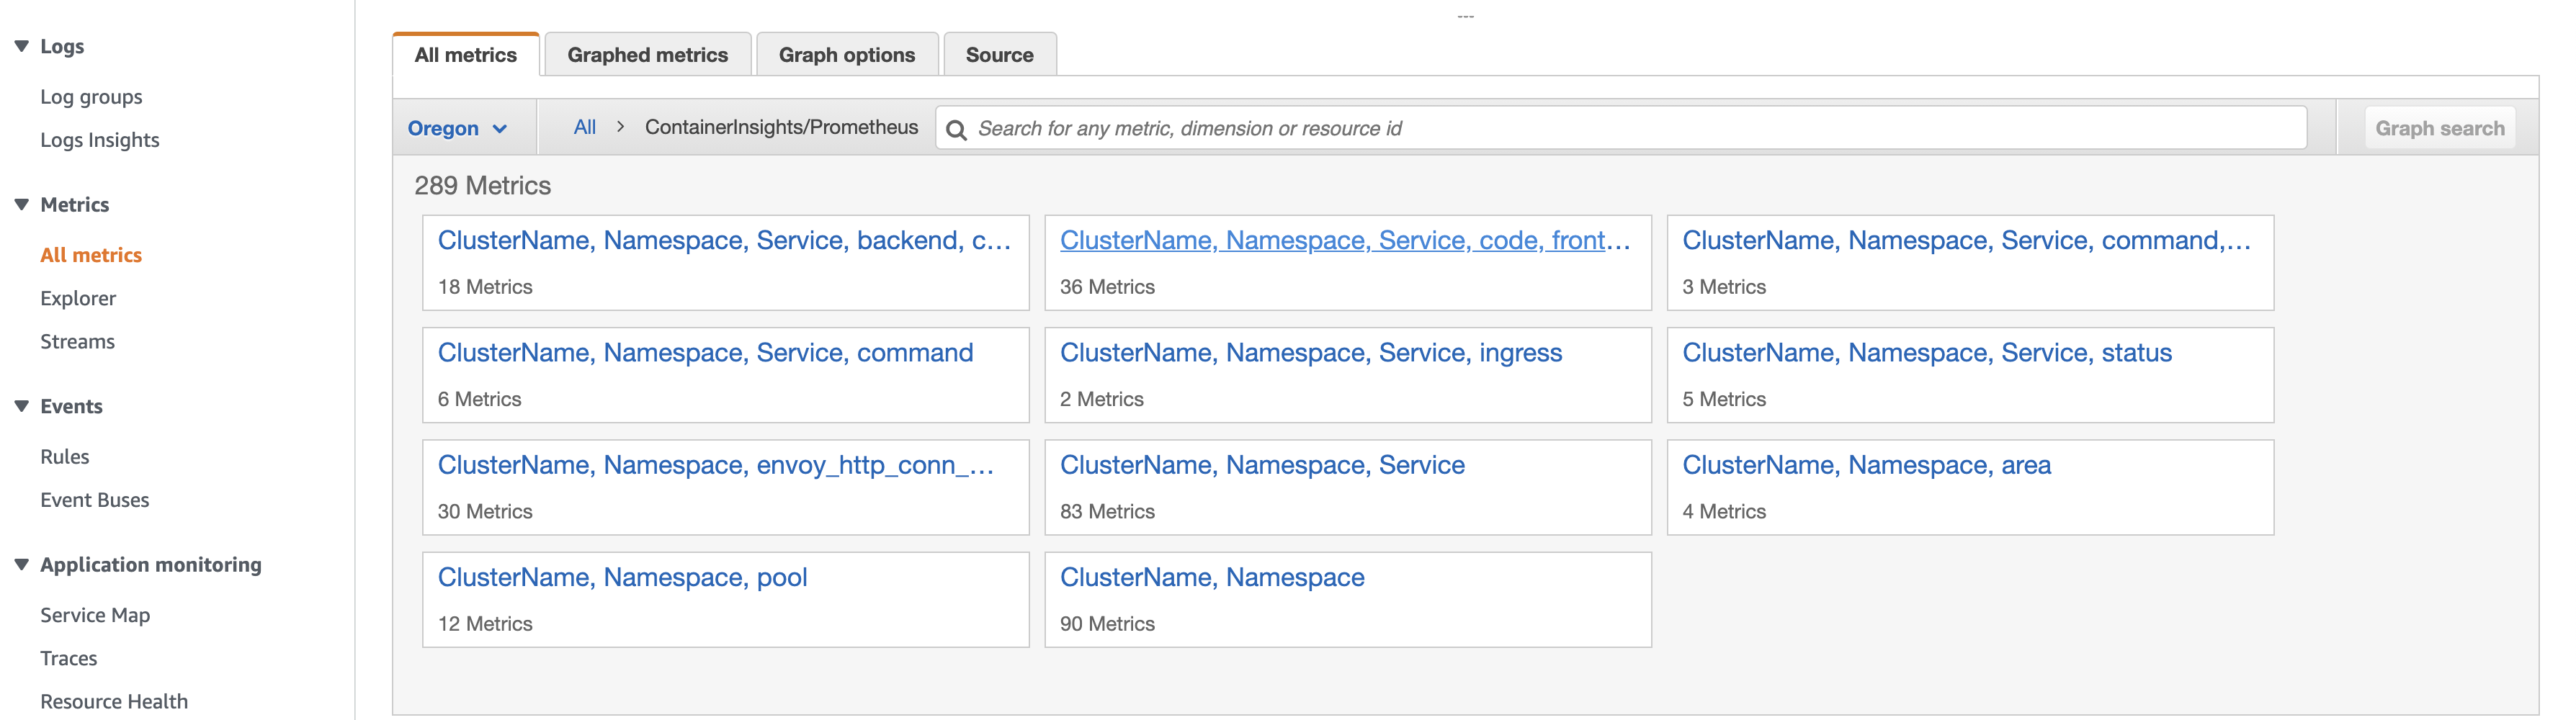
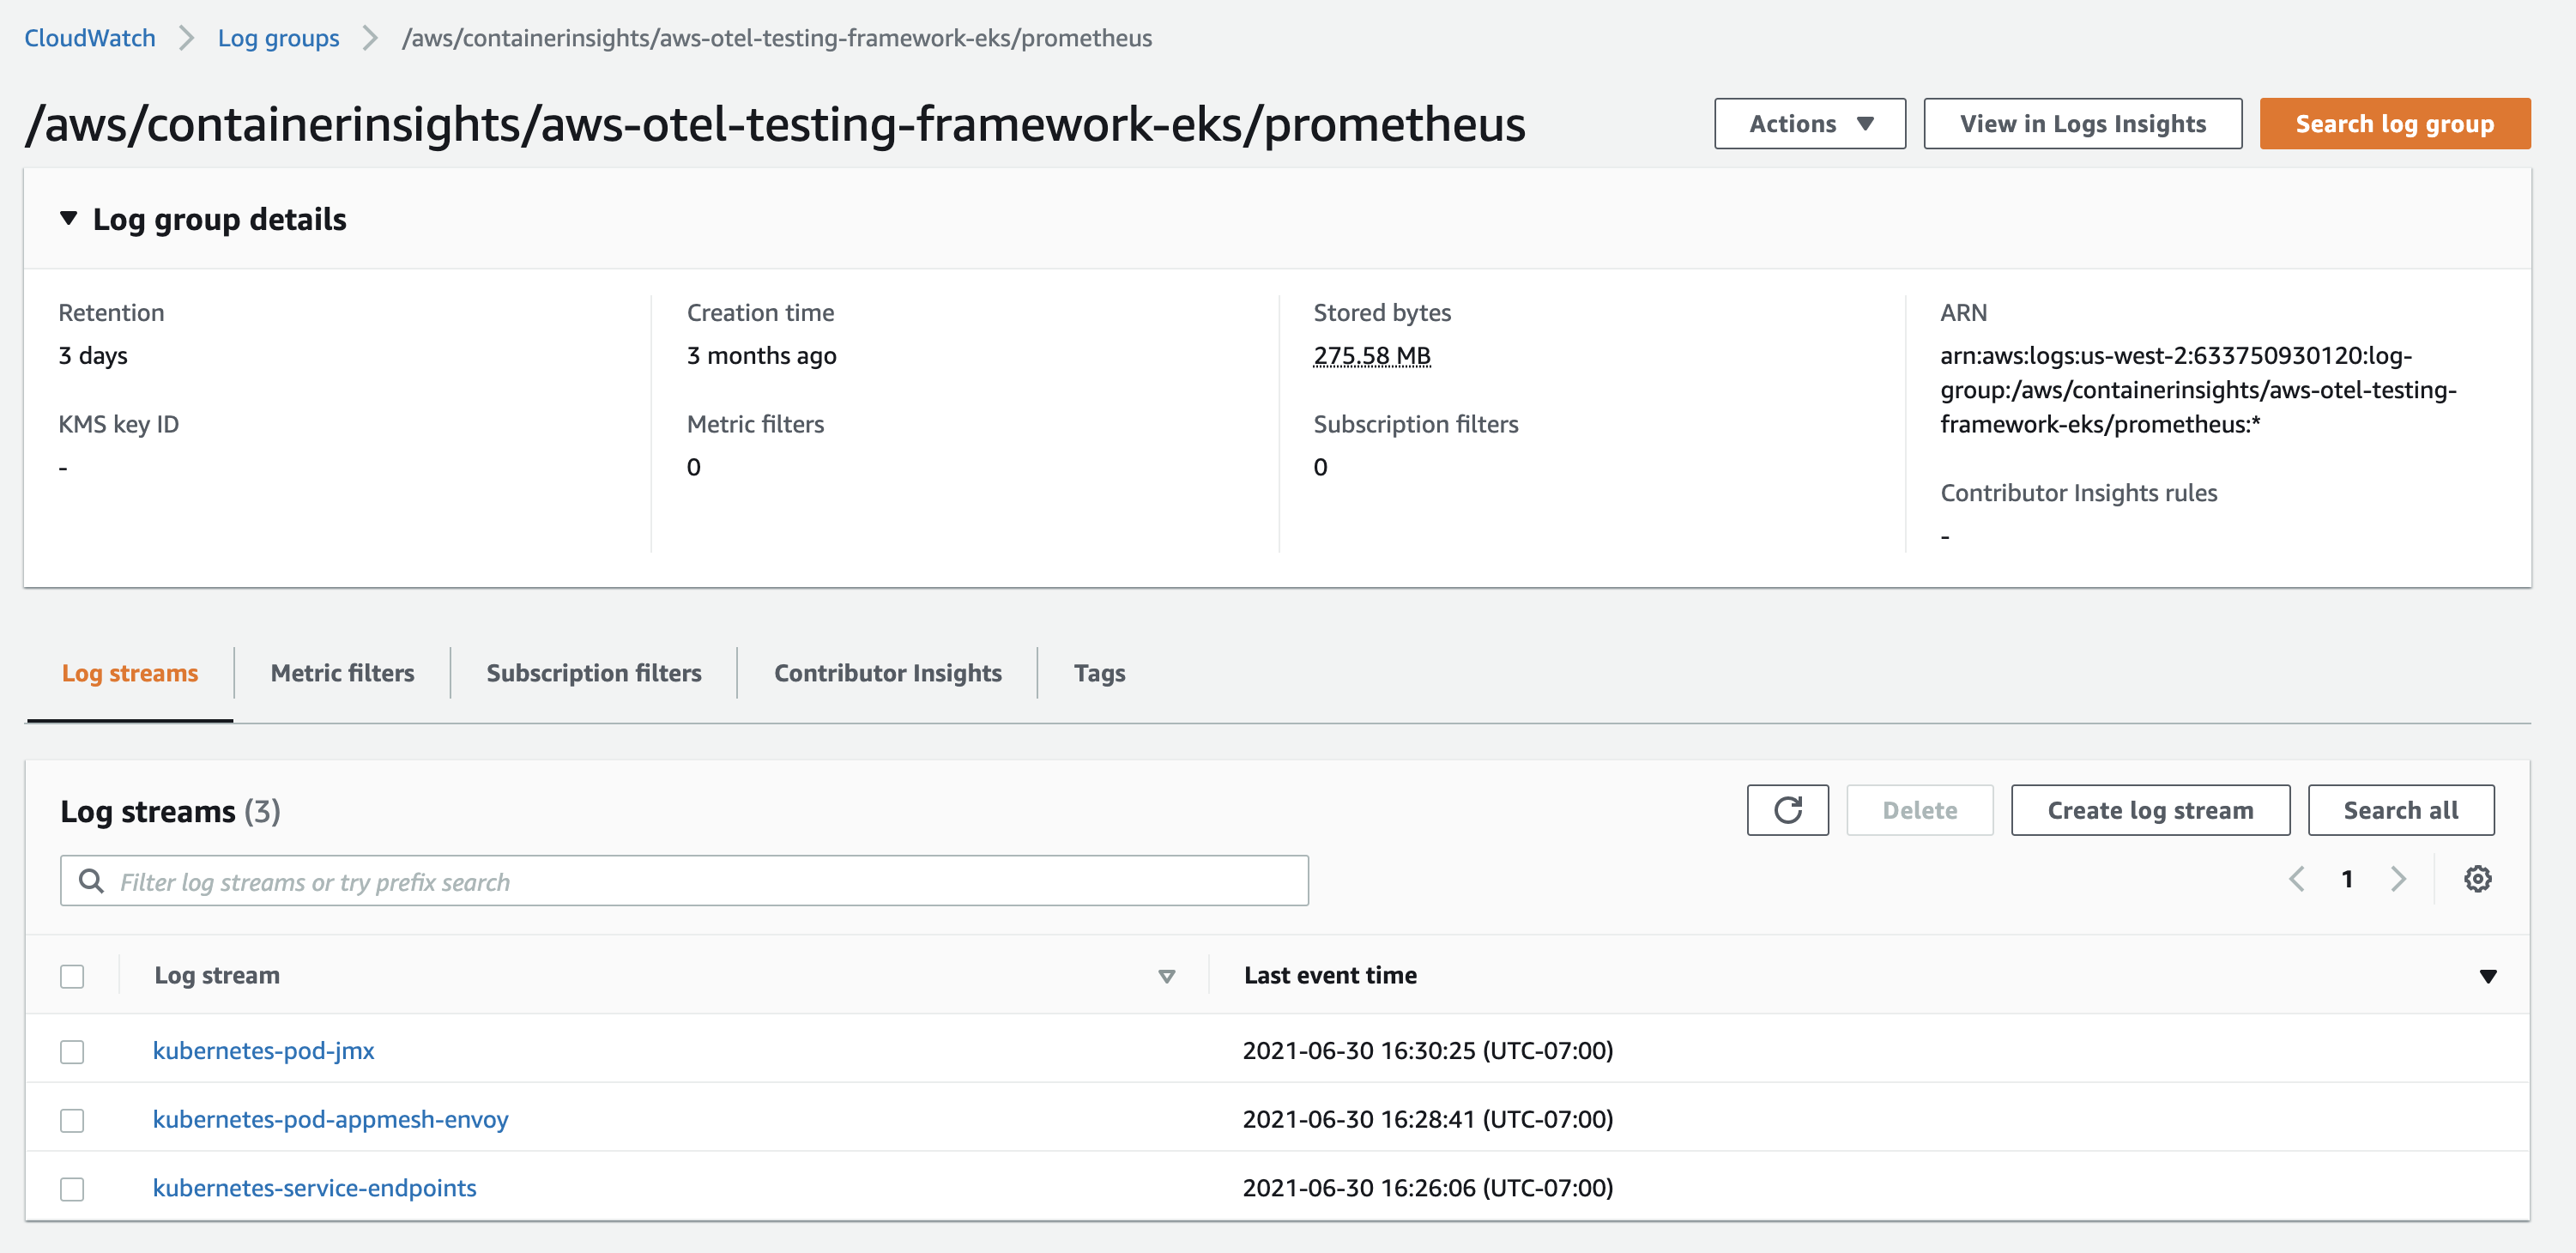
View your logs
To see the CloudWatch Logs events, choose Log groups in the navigation panel. The events are in the log group
/aws/containerinsights/{{cluster_name}}/prometheus.