AWS Distro for OpenTelemetry
Prerequisites and Configuration Setup Using ECS Console
Prerequisites and Configuration Setup Using ECS Console
Prerequisites
Before diving into the configuration setup with ECS Console V2, you have to setup the task role in order to give permissions for each of these tasks to access their prospective technologies.
Follow instructions to setup task execution permission & role.
Open the IAM console here
In order for Prometheus to operate properly it requires many permissions. Create an Amazon Managed Prometheus policies to role by selecting the policies tab in the navigation pane.
Choose Create policy, and then choose JSON.
- Follow instructions to create AMP IAM Policies.
- AmazonPrometheusFullAccess
- AmazonPrometheusConsoleFullAccess
- AmazonPrometheusQueryAccess
- AmazonPrometheusRemoteWriteAccess
The AWS Distro for OpenTelemetry Collector requires permissions for Amazon CloudWatch Logs for metric publishing, and for Amazon X-Ray for sending traces. Create an Amazon CloudWatch and X-Ray policies by selecting the policies tab in the navigation pane.
Choose Create policy, and then choose JSON.
- follow instructions to create IAM Policy
Now that you’ve created your policies and role, you must now attach these policies to your ECS task role that you’ve created in your first step.
Navigate back to the IAM console here and selecting the role tab in the navigation pane.
Find your created role.
Select Attach Policies and attach your newly created policies.
In this part of the getting started guide, you can set up the configurations by utilizing the newly developed ECS console for streamlined deployments of all of the above configurations.
Task Definition Setup
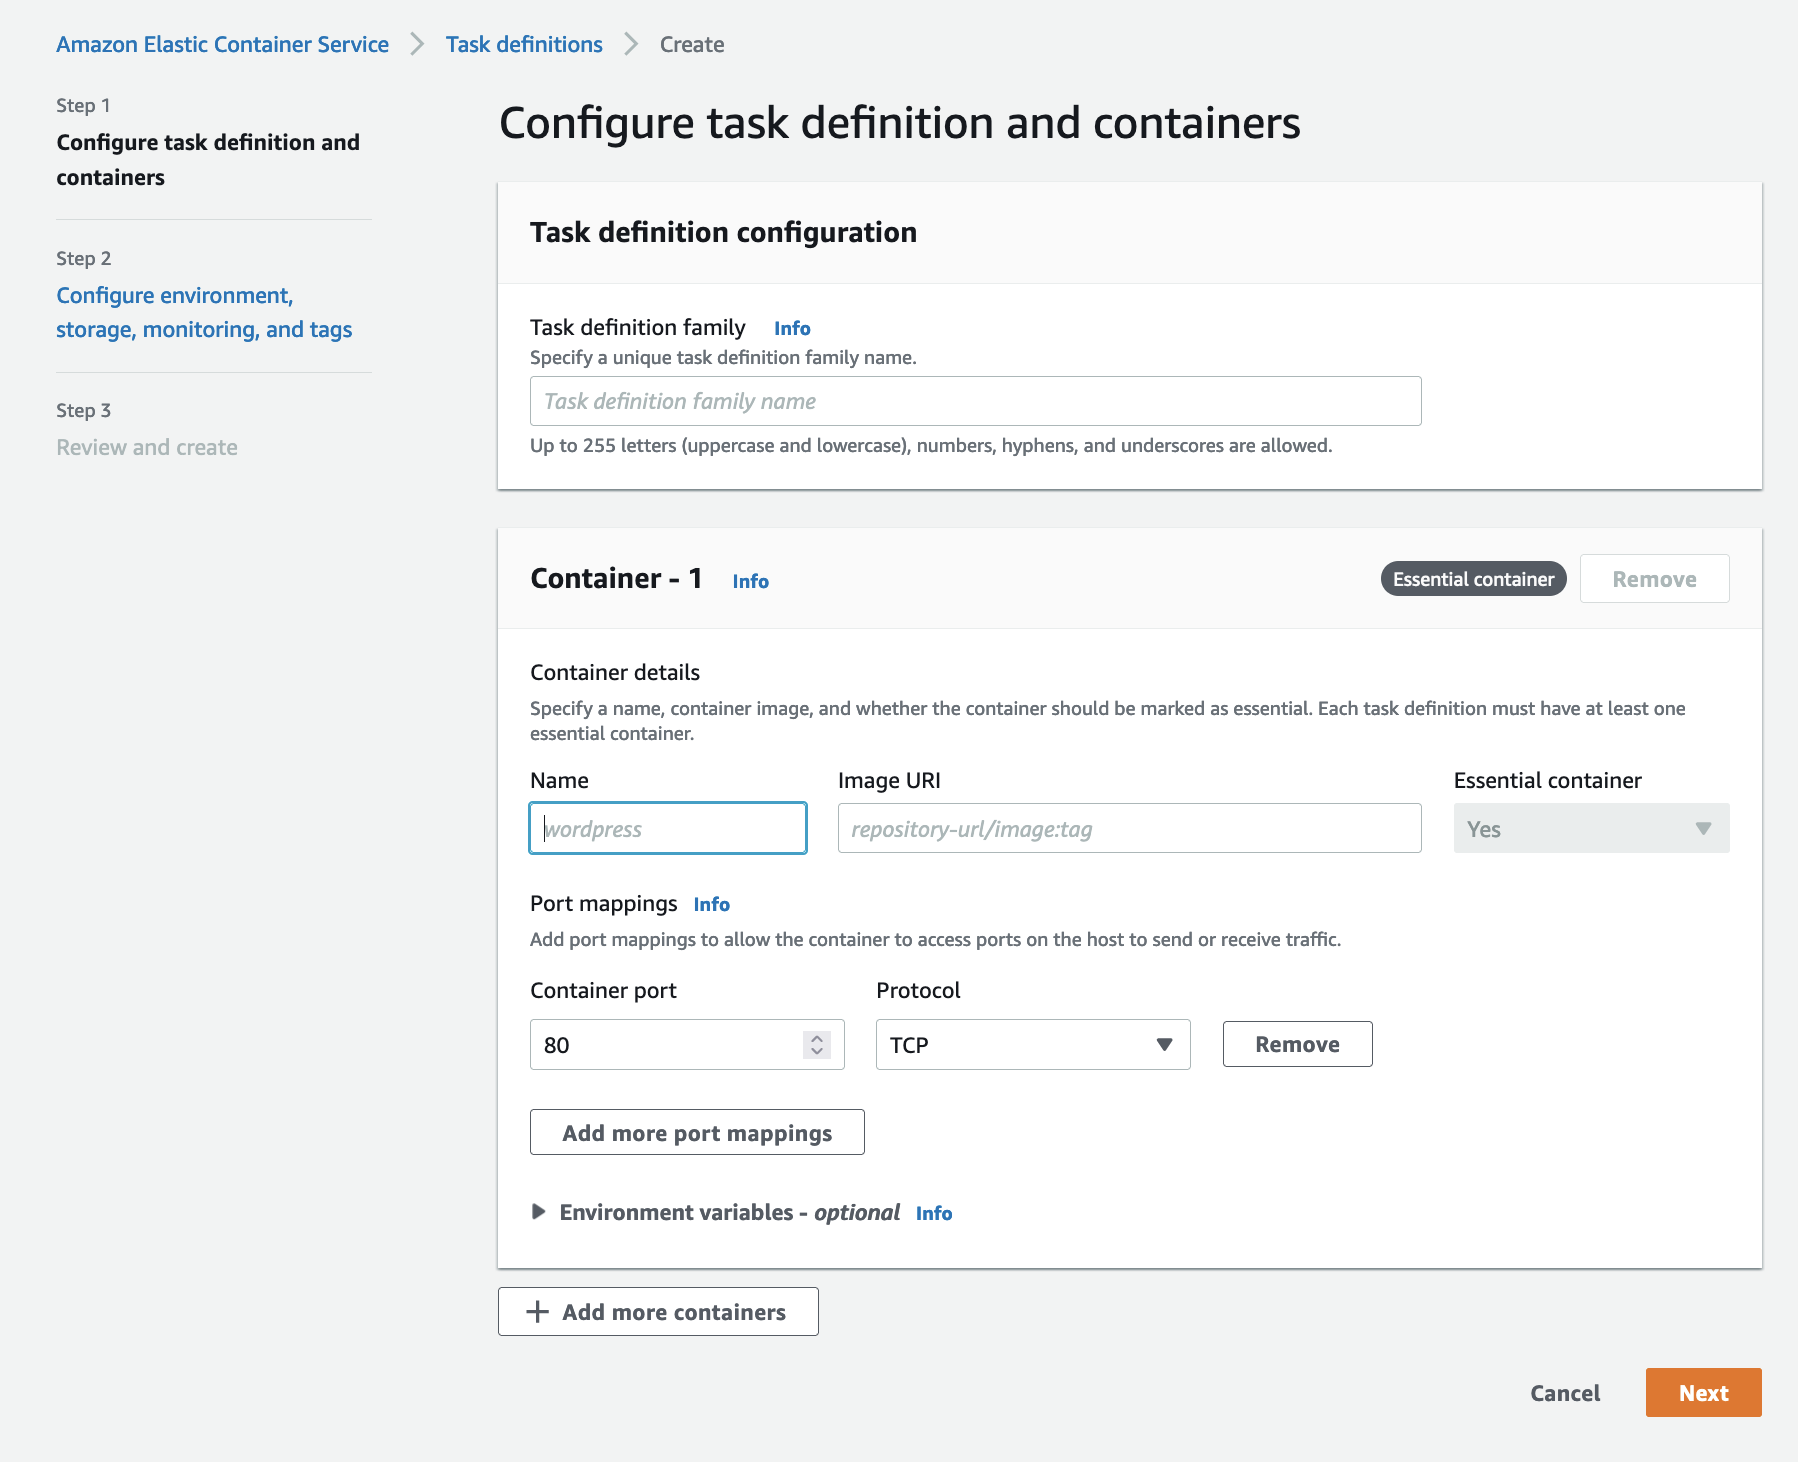
Step 1: In the first step of the ECS Console, you will be able to specify task definition family name, image URI if you would like to setup monitoring, container port mappings, and the necessary environment variables to setup your container ‘s environment (sample application).
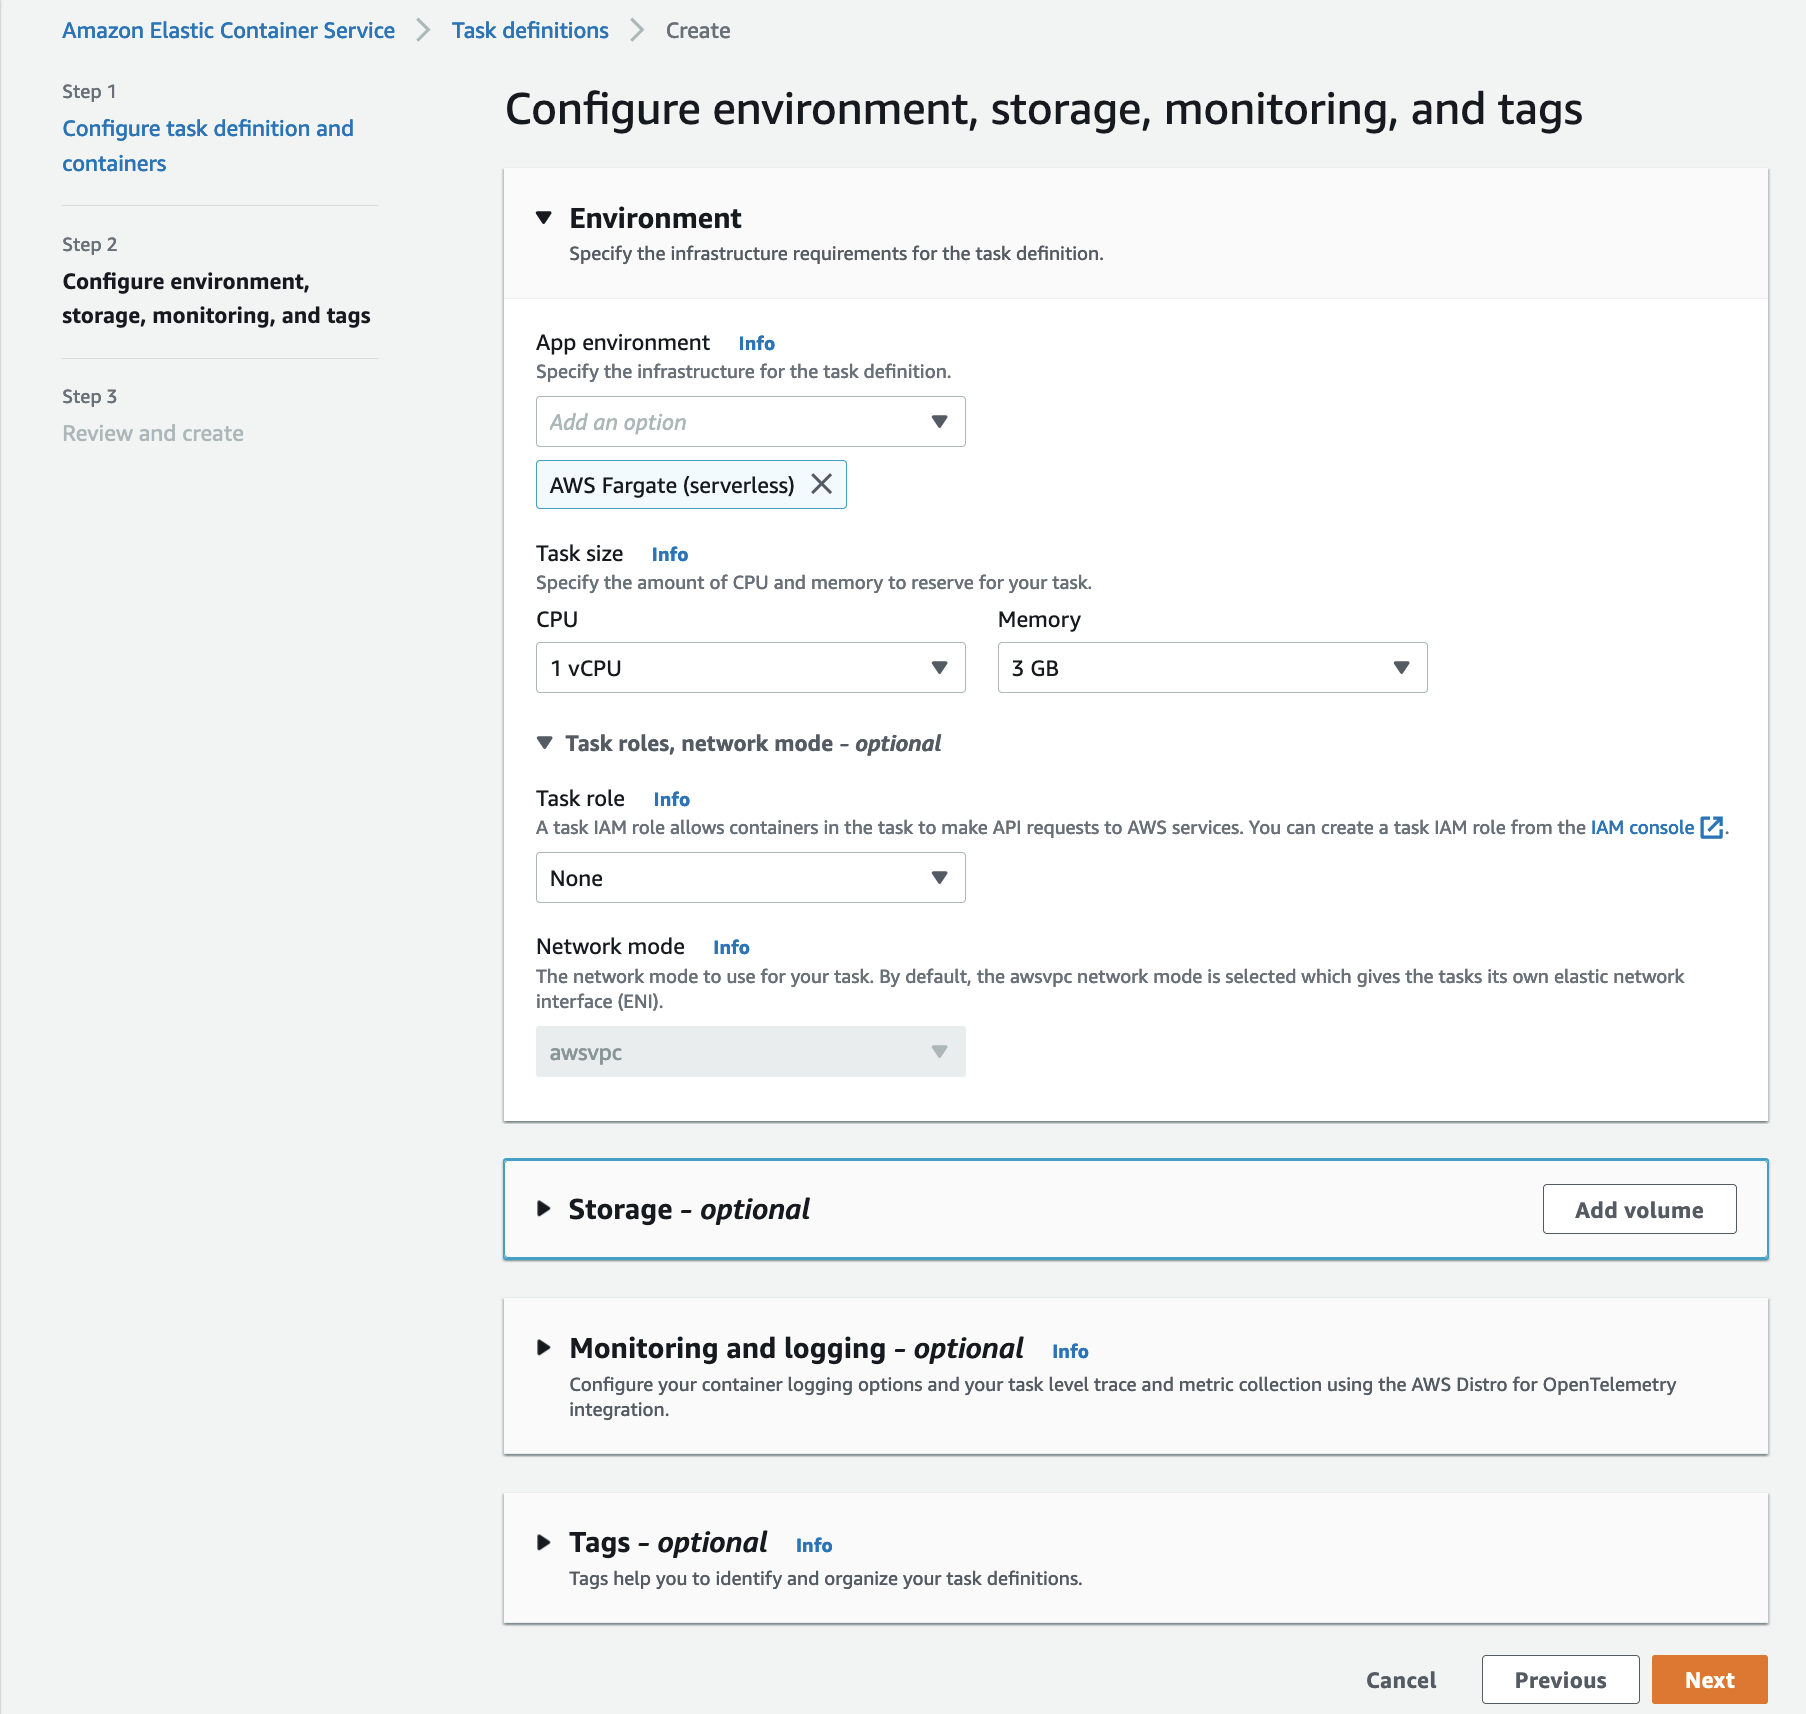
Step 2: In the second step, you will need to set up the environment with the necessary settings such as app environment, task size, task role, and storage.
Note: Please make sure the ask role has the correct IAM policies created in the prerequisite section. These are the required permissions for Amazon CloudWatch for metrics, AWS X-Ray for traces, and for Amazon Managed Service For Prometheus to access and query data.
Step 3: In this part of the getting started guide, you can set up the configurations by utilizing the newly developed ECS console for streamlined deployments of all of the above configurations.
After configuring the environment, you will have the option to select Monitoring and Logging in the UI below. In this section, Monitoring and Logging, you will be able to select configurations for log collection, metric collection or trace collection here.
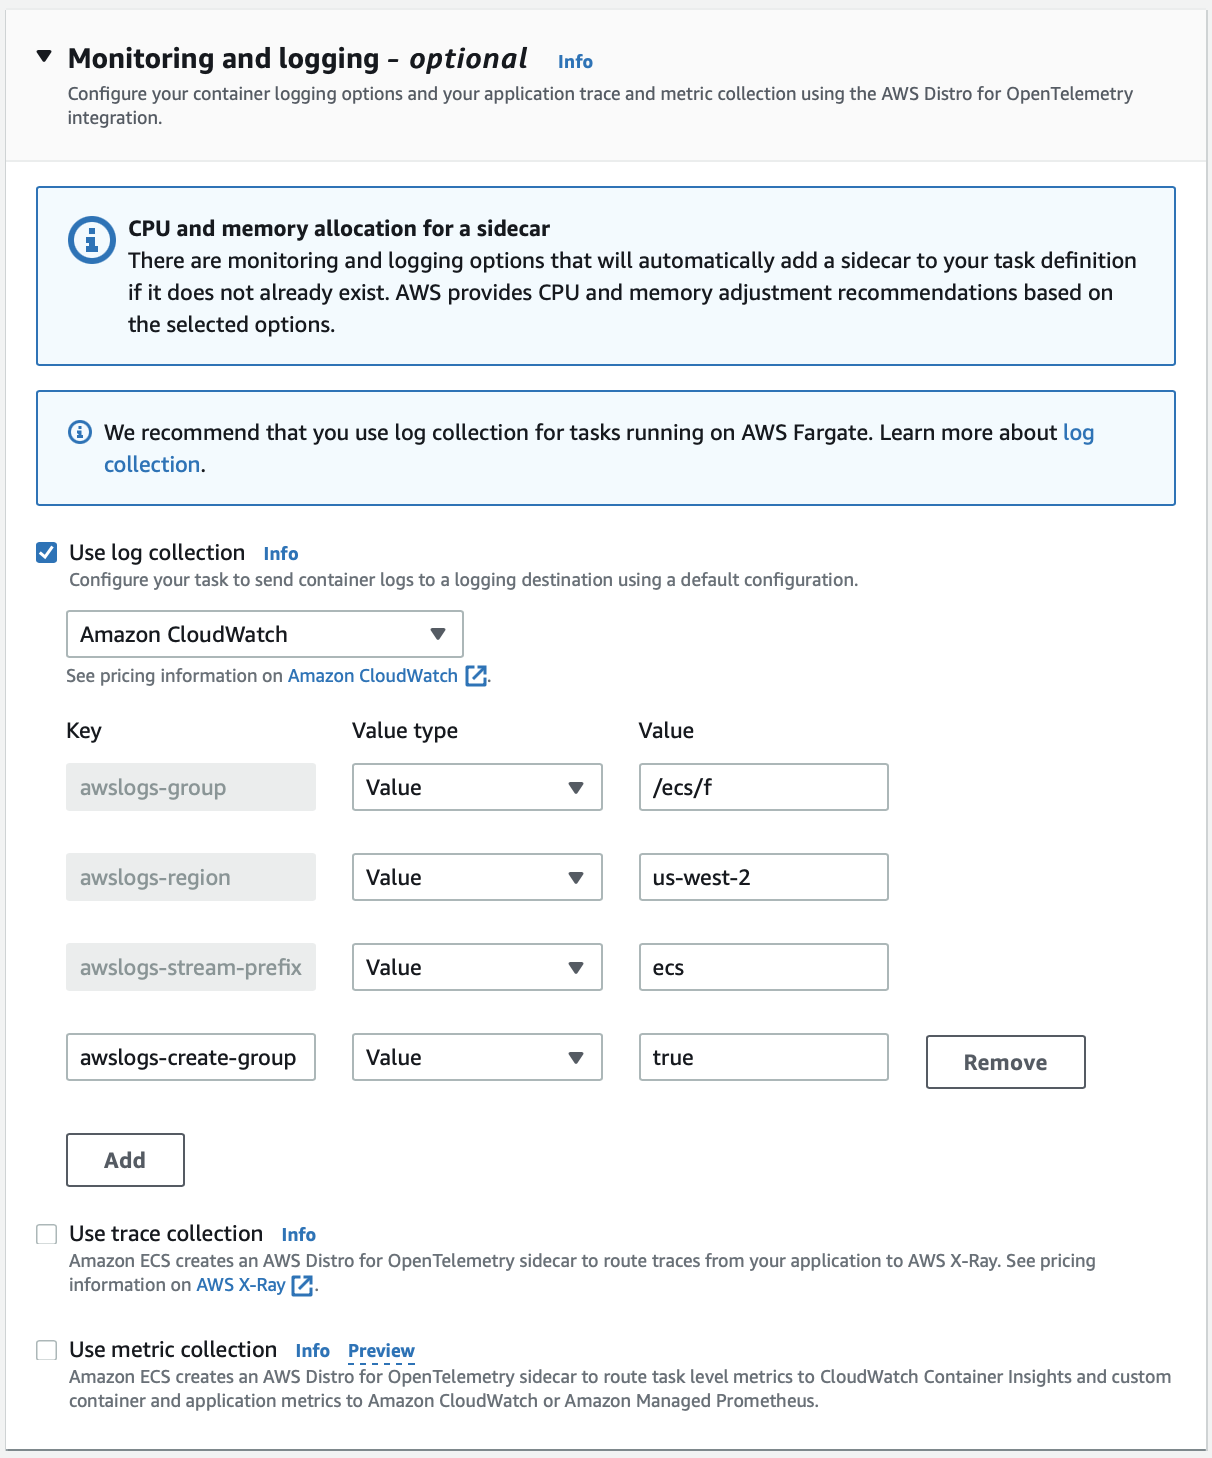
In the next screen, you can select the log collection parameters and criteria to which log collection service to utilize. You can also specify criteria for collection of trace data to AWS X-Ray and utilize the AWS X-Ray console to observe traces. In the metric collection section, you can select the destination to send your metric metadata to Amazon CloudWatch or Amazon Managed Service for Prometheus (AMP) by specifying the AMP endpoint.
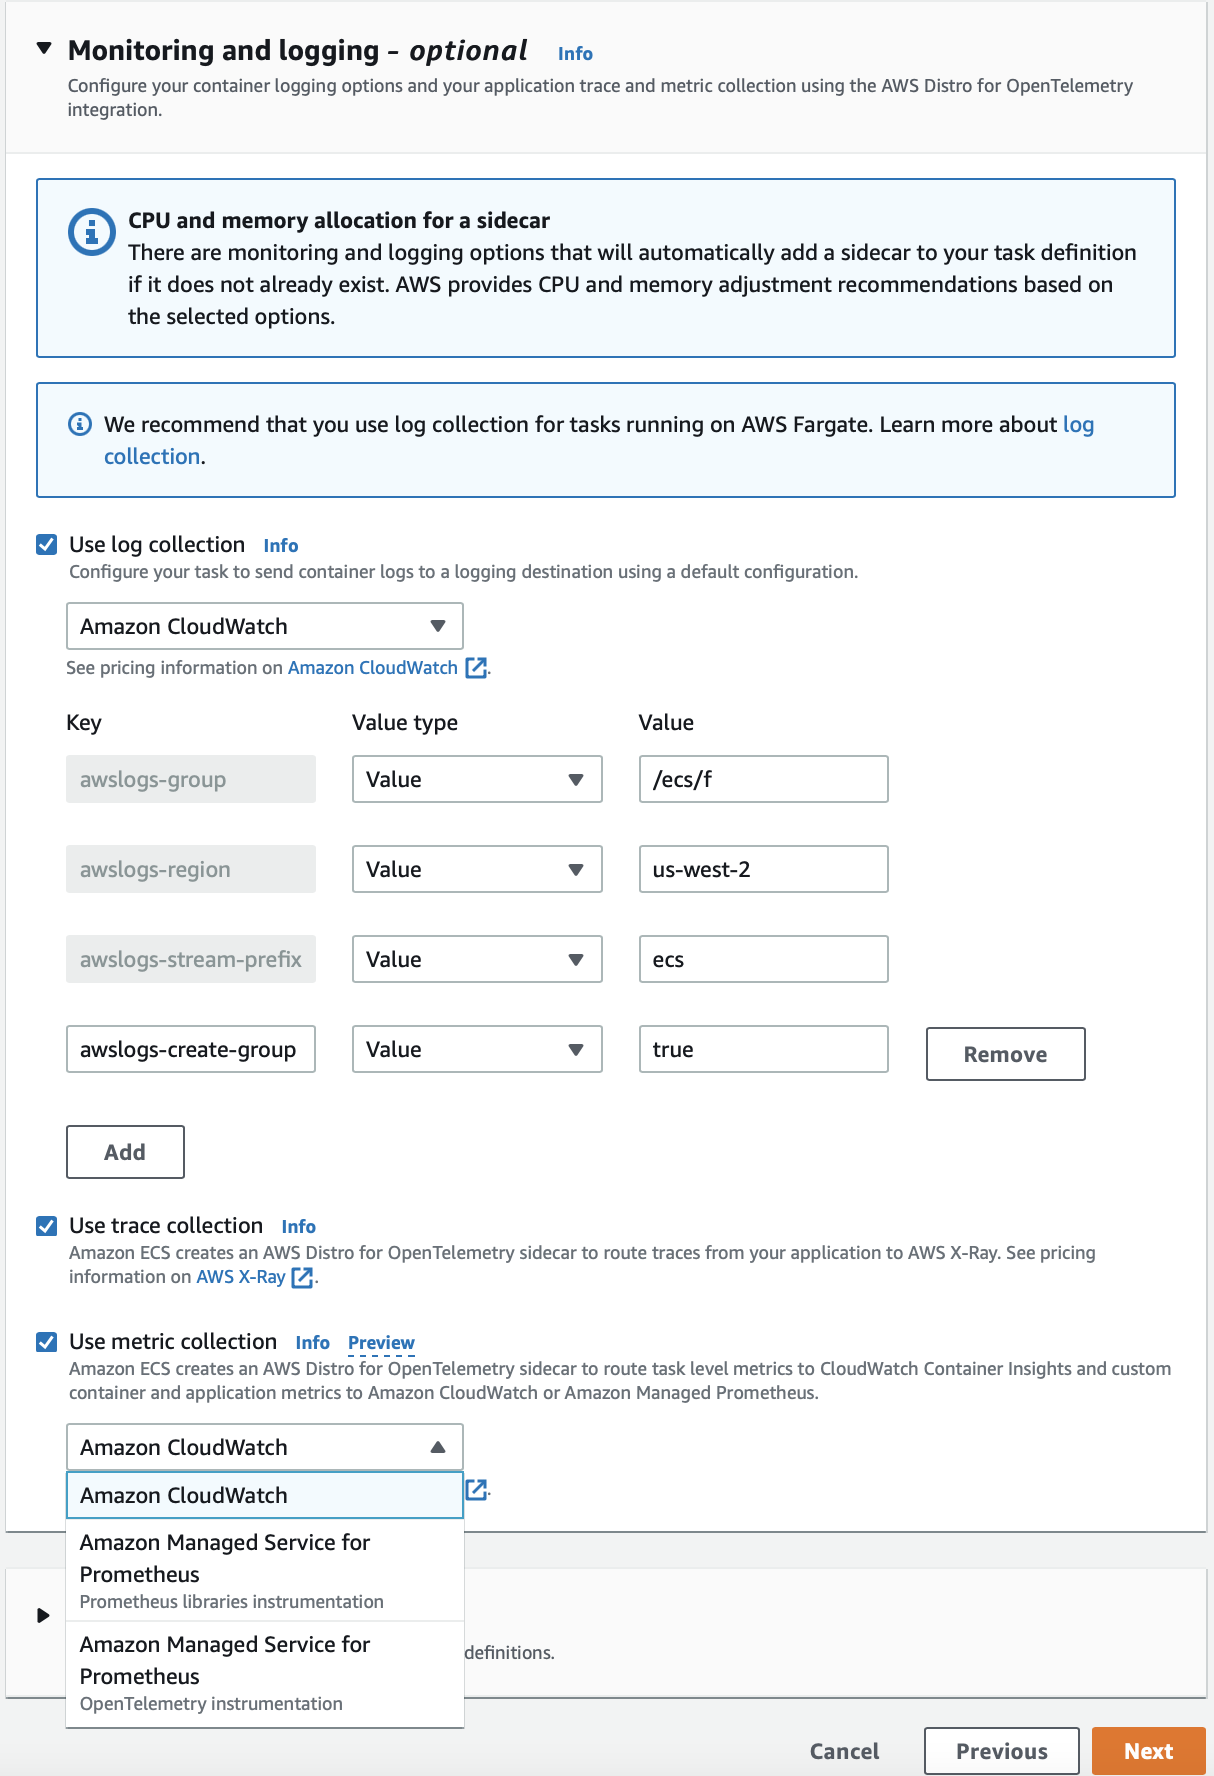
Note: Before utilizing Amazon Managed Service for Prometheus, we must create a Amazon Managed Service for Prometheus workspace so we can obtain the endpoint to send the data to Prometheus. Follow this guide to set up Amazon Managed Service for Prometheus and input the Endpoint - remote write URL into the Amazon Managed Service for Prometheus endpoint section of metric collection. One option to viewing your application metrics from Prometheus is utilizing Amazon Grafana which can be setup by following this guide.
Cluster Setup
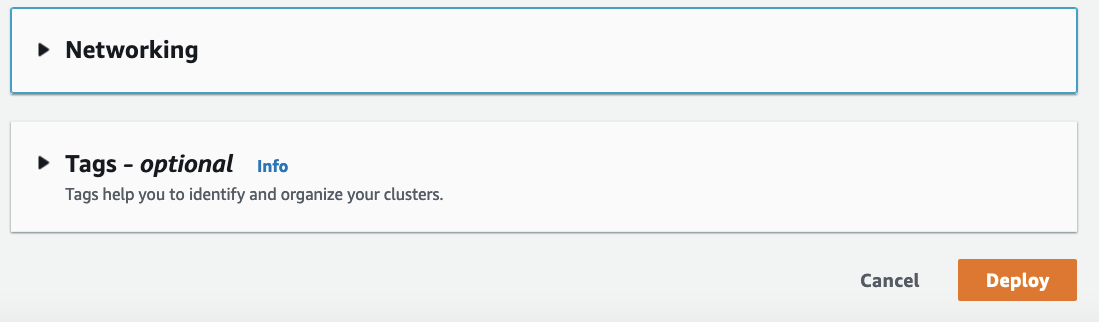
Step 1: In the first step, enter the cluster name and move to networking.
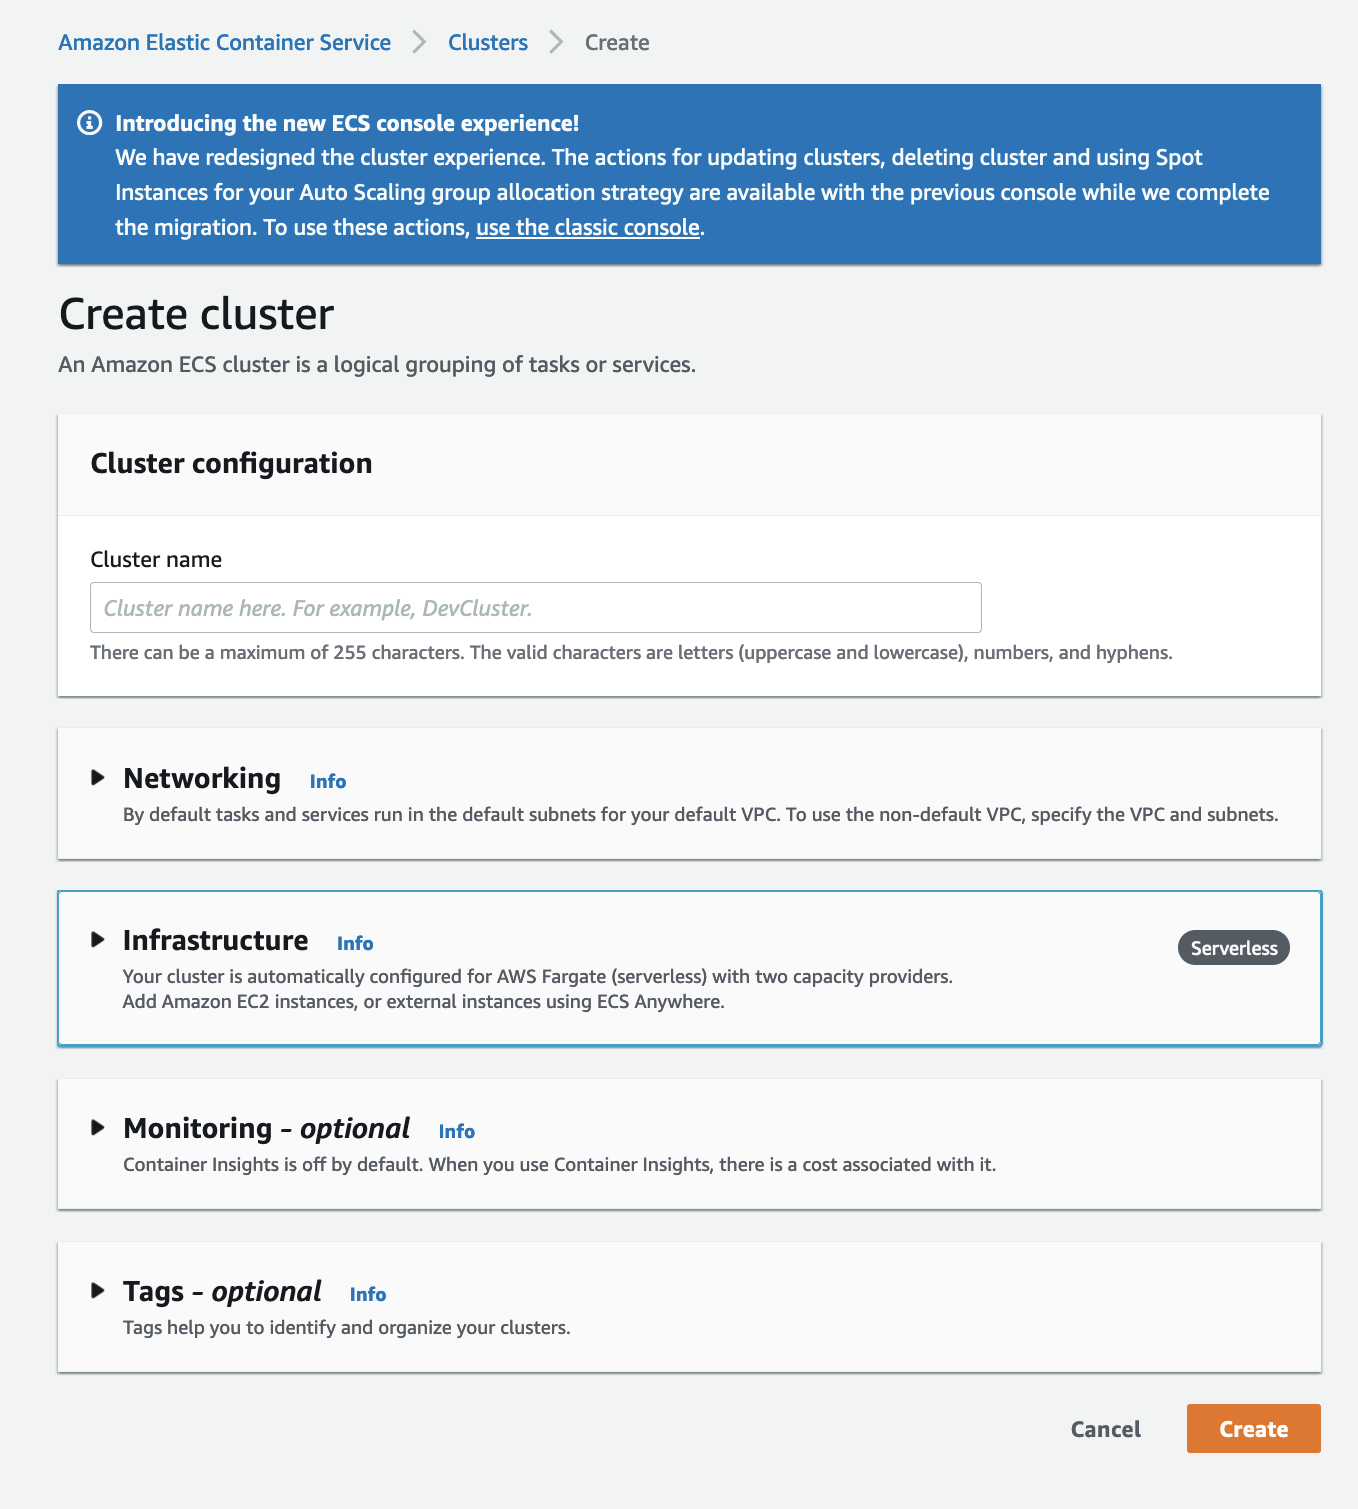
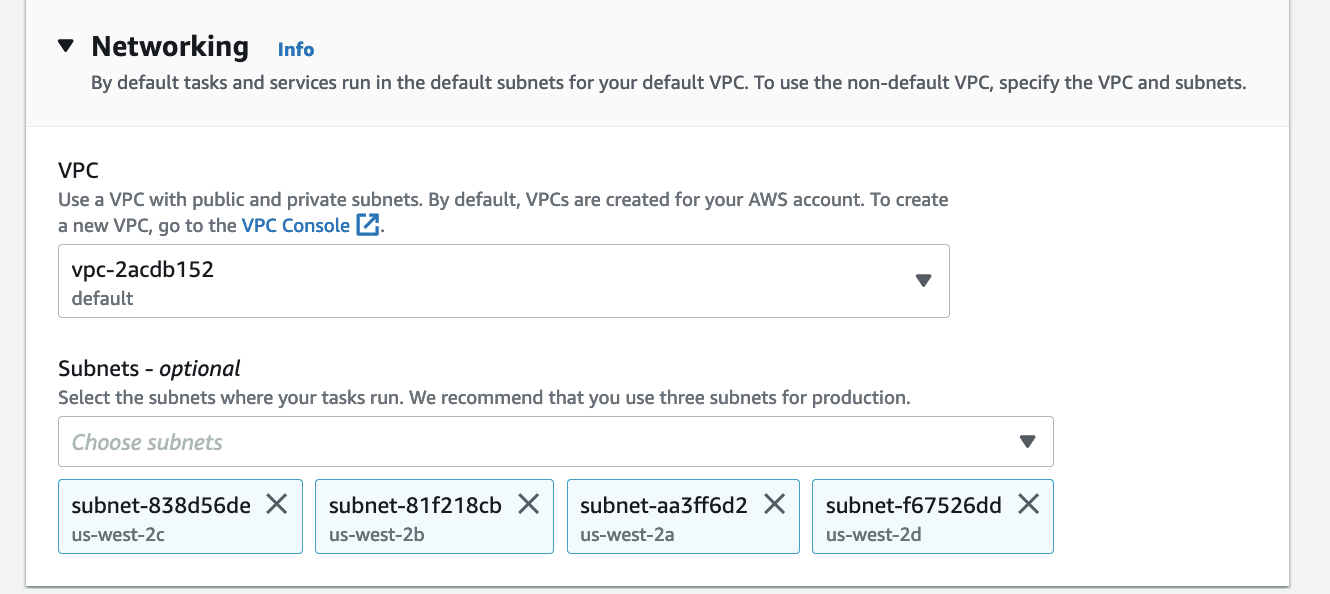
Step 2: In the networking tab, the VPCs is created by default. Select all of the public & private subnets (if available). You can also create a new customized VPC by following the steps here. If you want to create a VPC with public & private subnets follow the steps here.
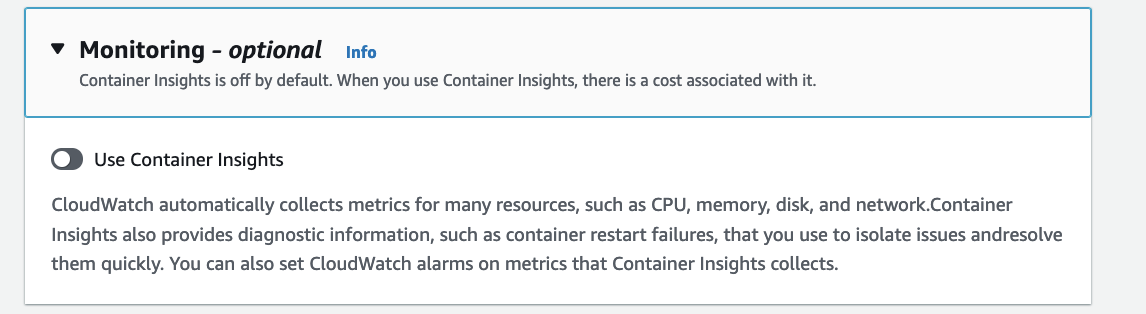
Step 3: You can enable Container Insights at the Amazon ECS cluster level to receive those metrics. For more information, see Amazon ECS CloudWatch Container Insights.
Once, you have verified the networking, infrastructure and monitoring. create the cluster.
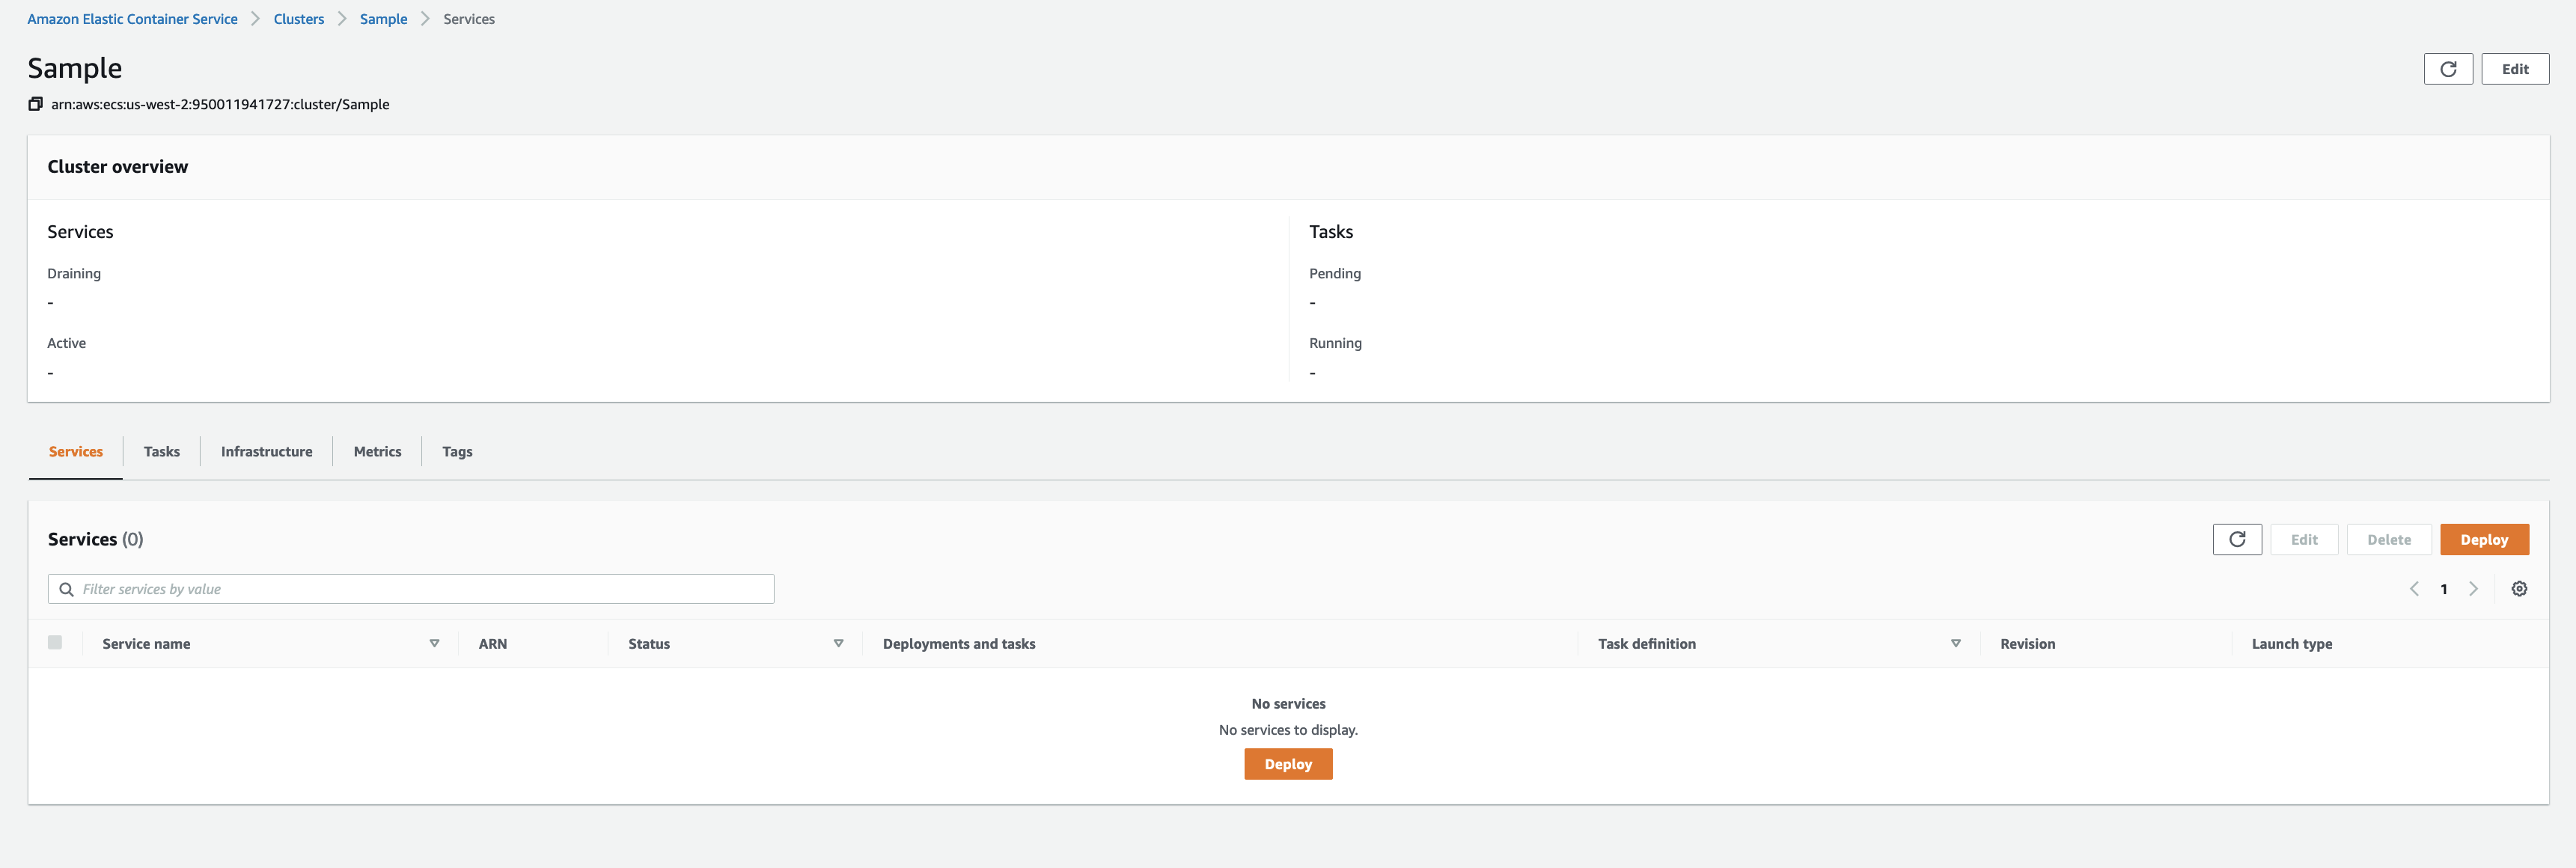
Deployment of task
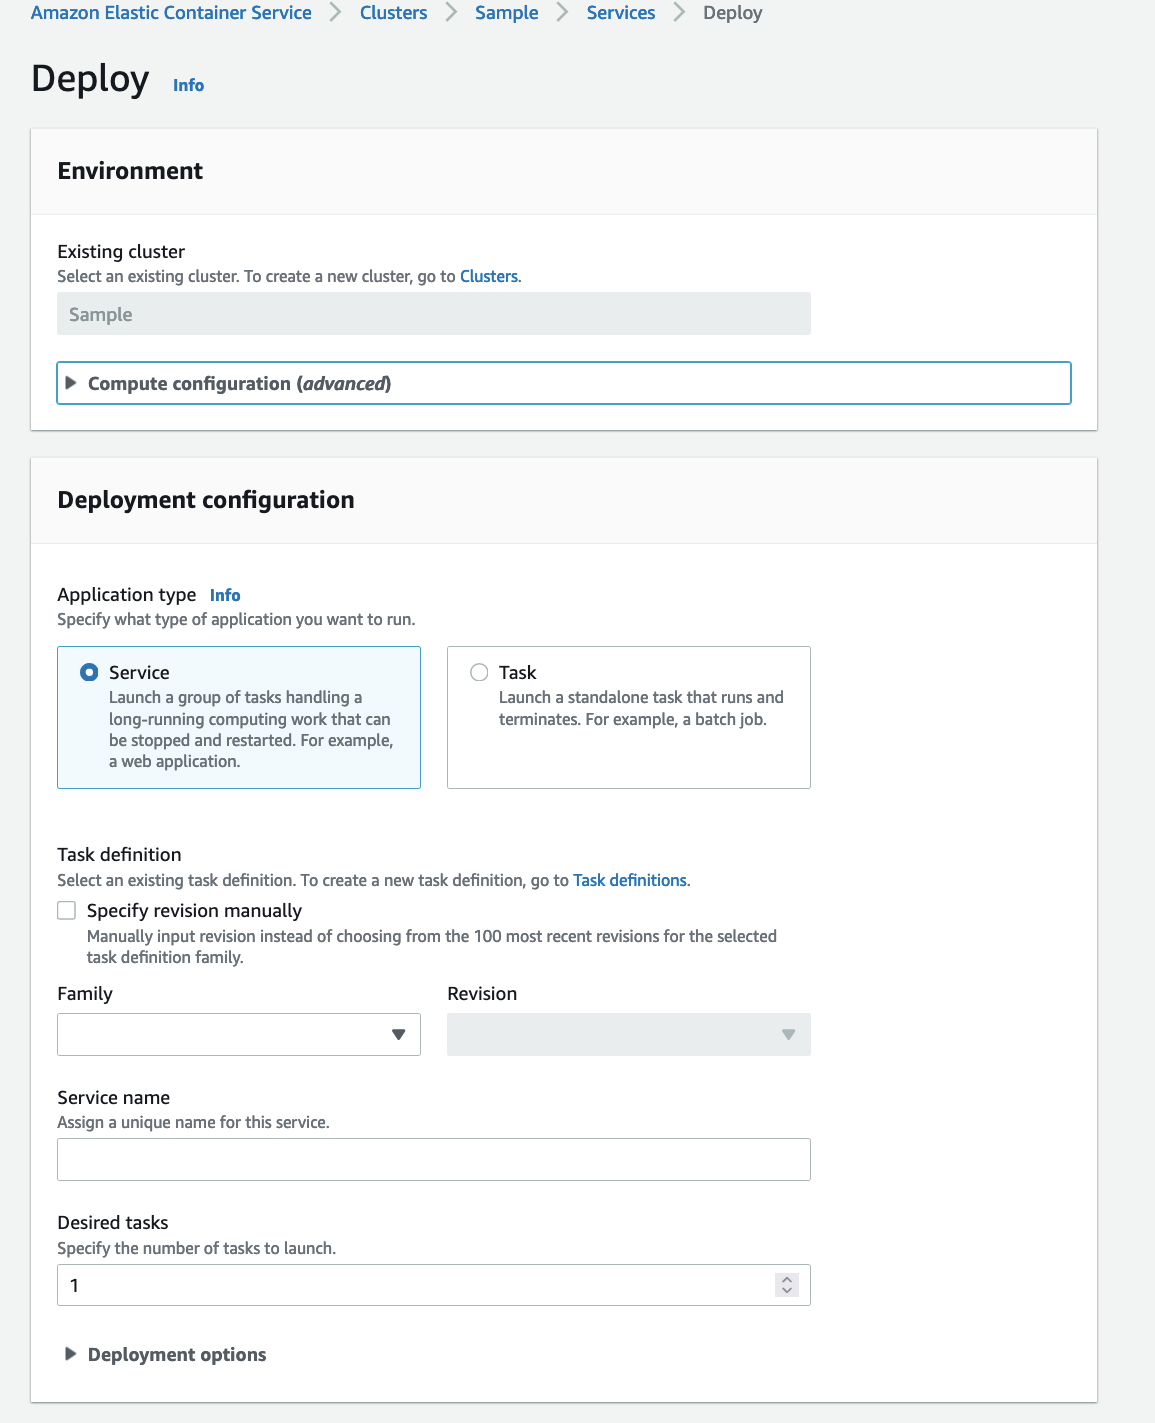
Step 1: To deploy the task, select the cluster you have created, go to services and choose deploy.
Step 2: In the deployment configuration, select the task definition under family drop down. Assign a unique service name and specify the number of tasks to launch.
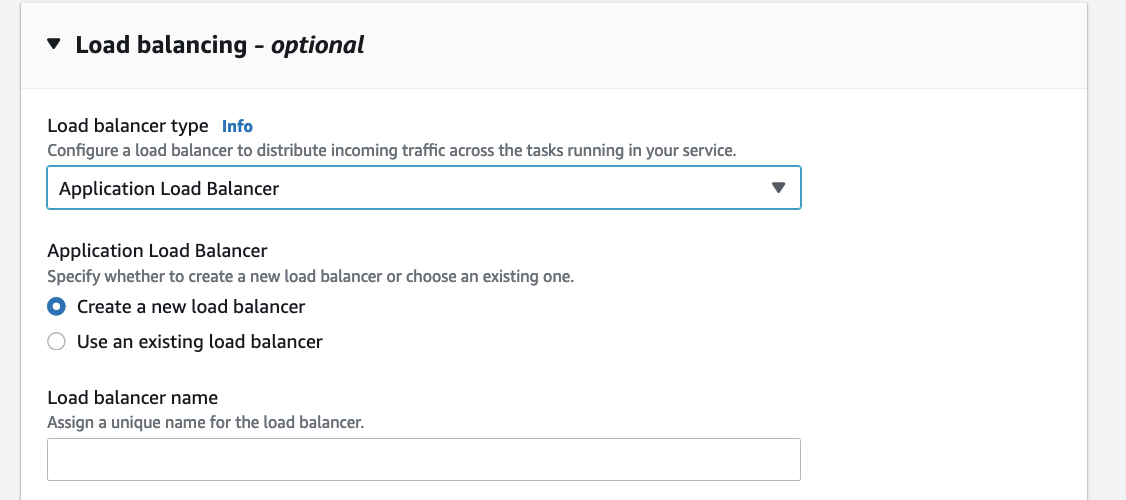
Step 3: Create a new load balancer by selecting the drop down option Application Load Balancer.
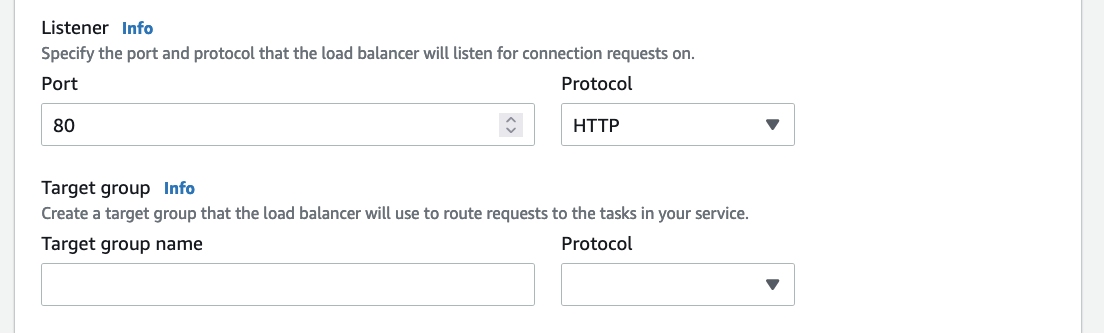
You need to specify the port and protocol that load balancer will listen to and also create a target group to route requests to your deployed tasks.
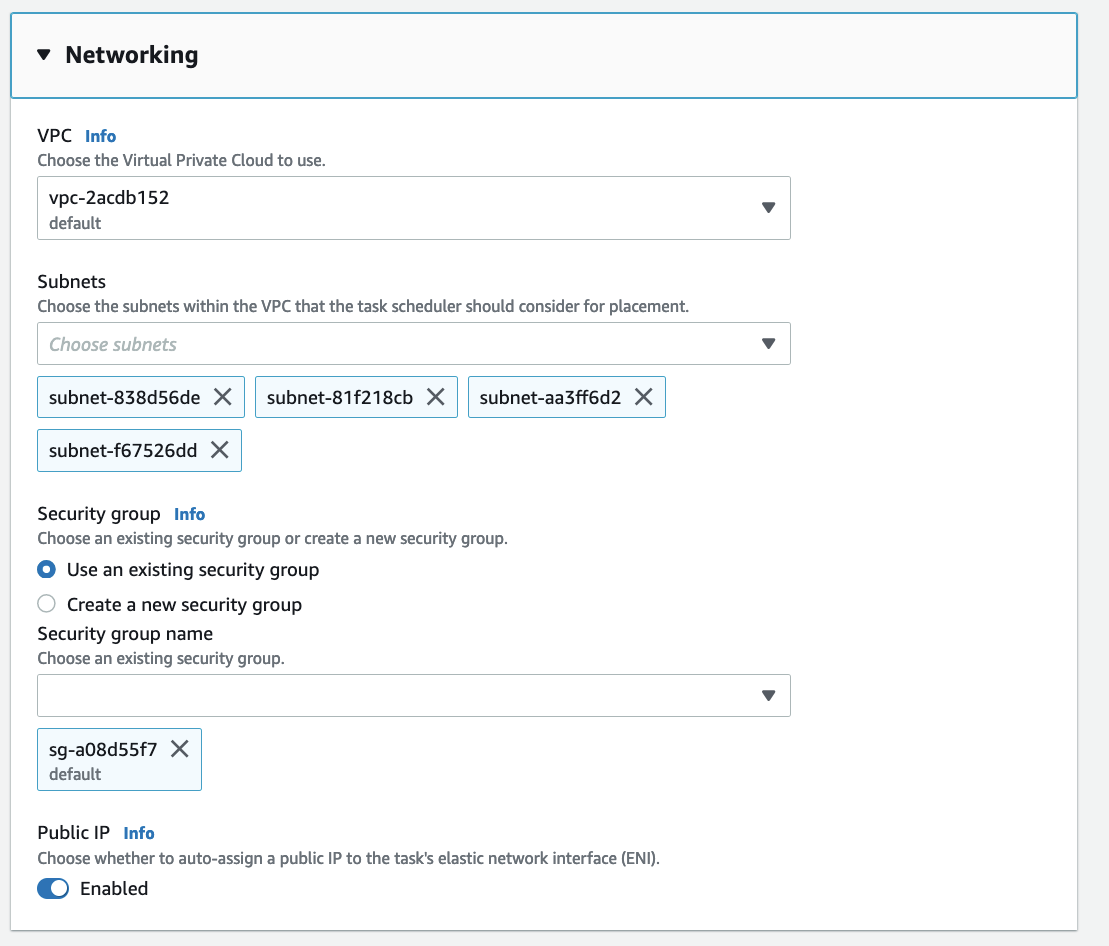
Step 4: In the networking section, you can choose the default VPC and subnets. There will be an existing default security group that you can select. If that option is not available create a new security group for your VPC. Depending on your task, you can assign a Public IP address to your ENI.
Step 5: After configuring the deployment configurations, load balancing and networking, click on deploy.
Please wait for few minutes until the task is deployed and running.
In order to view your metrics and traces Amazon provides many monitoring services such as AWS X-Ray , Amazon Managed Grafana , and Amazon CloudWatch .