AWS Distro for OpenTelemetry
Using the AWS Distro for OpenTelemetry Go SDK
Using the AWS Distro for OpenTelemetry Go SDK
Introduction
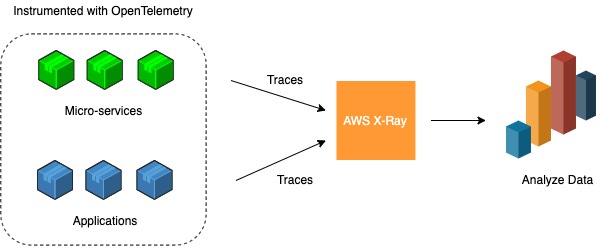
Welcome to the AWS Distro for OpenTelemetry (ADOT) Go getting started guide. This walk-through covers the ADOT Go components, how to configure the ADOT components to capture traces and metrics with OpenTelemetry Go, as well as how to use the AWS Elastic Container Service (AWS ECS) and AWS Elastic Kubernetes Service (AWS EKS) resource detectors. Before reading this guide, you should familiarize with distributed tracing/metrics and the basics of OpenTelemetry. To learn more about getting started with OpenTelemetry Go, see the OpenTelemetry developer documentation.
Requirements
Go v1.19 or later is required to run an application using OpenTelemetry. Visit the compatibility chart of OpenTelemetry Go SDK with different OS, Go Version and Architecture.
Note: You’ll also need to have the ADOT Collector running to export traces and metrics.
Installation
Download and install the following packages to use ADOT Components with OpenTelemetry Go SDK for tracing.
1. X-Ray ID Generator2. X-Ray propagator3. OTel Go SDK for tracing4. OTel Go API for tracing5. OTLP gRPC exporter for exporting trace data6. OTel Go SDK for metrics7. OTel Go API for metrics8. OTLP gRPC exporter for exporting metric dataTo install the above mentioned necessary prerequisites, run the following command in the same directory that the application go.mod file is in:
go get go.opentelemetry.io/contrib/propagators/aws/xraygo get go.opentelemetry.io/otelgo get go.opentelemetry.io/otel/exporters/otlp/otlptrace/otlptracegrpcgo get go.opentelemetry.io/otel/sdk/resourcego get go.opentelemetry.io/otel/sdk/tracego get go.opentelemetry.io/otel/sdk/metricgo get go.opentelemetry.io/otel/exporters/otlp/otlpmetric/otlpmetricgrpcSetting up the Global Tracer
Sending Traces
This section talks about how to instantiate a new tracer provider with the X-Ray ID generator and sampling config, setting global options (X-Ray propagator, tracer provider) and instantiate OTLP exporter with the collector's address to export trace data.
Creating an OpenTelemetry Protocol (OTLP) Exporter
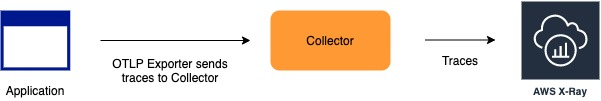
OpenTelemetry Go requires an exporter to send traces to a backend. Exporters allow telemetry data to be transferred either to the AWS Distro for OpenTelemetry Collector (ADOT Collector), or to a remote system or console for further analysis. The ADOT Collector is a separate process that is designed to be a "sink" for telemetry data emitted by many processes, which can then export that data to various back-end systems.
To initialize the OTLP trace exporter, add the following code to the file the main.go file.
IMPORTANT: The following examples creates an OTLP exporter that does not encrypt data at transfer because it uses the otlptracegrpc.WithInsecure() option. This should only be used for creating proof of concepts and experimenting with the Go SDK.
For production environments you must properly configure TLS using the otlptracegrpc.WithTLSCredentials function.
1// Create and start new OTLP trace exporter2traceExporter, err := otlptracegrpc.New(ctx, otlptracegrpc.WithInsecure(), otlptracegrpc.WithEndpoint("0.0.0.0:4317"), otlptracegrpc.WithDialOption(grpc.WithBlock()))3if err != nil {4 log.Fatalf("failed to create new OTLP trace exporter: %v", err)5}This creates a new OTLP exporter with a few options - WithInsecure() disables client transport security for the exporter's gRPC connection, WithEndpoint() allows you to set the address that the exporter will connect to the Collector on. If the address is unset, it will instead try to use connect to localhost:4317. If the Collector you are connecting uses TLS, for example in a service deployment,
pass otlptracegrpc.WithTLSCredentials() instead of otlptracegrpc.WithInsecure().
Creating a Tracer Provider
In order to generate traces, OpenTelemetry Go SDK requires a tracer provider to be created. A tracer provider can have multiple different span processors, which are components that give the ability to modify and export span data after it has been created.
To create a new tracer provider, add the following lines to the main.go file.
1idg := xray.NewIDGenerator()2
3tp := trace.NewTracerProvider(4 trace.WithSampler(trace.AlwaysSample()),5 trace.WithBatcher(traceExporter),6 trace.WithIDGenerator(idg),7)Above block of code creates a new TracerProvider with a Sampler that samples every trace, and an ID Generator that will generate trace IDs that conform to AWS X-Ray’s format, as well as register the OLTP exporter we created in the previous section.
Setting Global Options
In addition to setting a global tracer provider, we will also configure the context propagation option. Context propagation refers to sharing data across multiple processes or services. Propagator structs are configured inside Tracer structs to support context propagation across process boundaries. A context will often have information identifying the current span and trace, and can contain arbitrary information as key-value pairs.
To set up global options, we will use the otel package and add the following lines to the main.go file.
1otel.SetTracerProvider(tp)2otel.SetTextMapPropagator(xray.Propagator{})Using the AWS resource Detectors
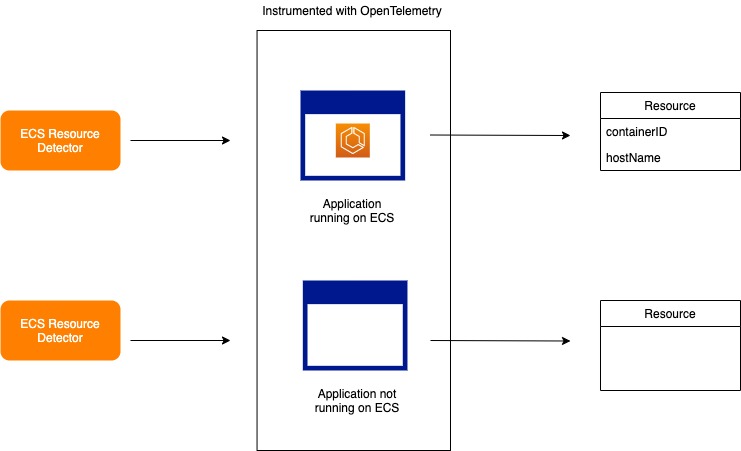
OpenTelemetry Go SDK has Amazon EC2, ECS and EKS resource detector support. The resource detectors are responsible for detecting whether a Go application instrumented with OpenTelemetry is running on the respective environment, and populating resource attributes for that environment if available. If the resource detector detects that the application
is not running on an environment (EC2, ECS or EKS), then it will return an empty resource struct.
Run go get go.opentelemetry.io/contrib/detectors/aws/ec2 command to import the EC2 resource detector module. The following code snippet demonstrates how to use the EC2 resource detector. Visit OpenTelemetry AWS Resource Detectors README to get more information on which environment attributes are being captured by resource detectors.
1// Instantiate a new EC2 Resource detector2ec2ResourceDetector := ec2.NewResourceDetector()3resource, err := ec2ResourceDetector.Detect(context.Background())4
5// Associate resource with TracerProvider6tracerProvider := trace.NewTracerProvider(7 trace.WithResource(resource),8)Setting up the Global Meter
Sending metrics
This section talks about how to instantiate a new meter provider , setting global options (meter provider) and instantiate OTLP exporter with the collector's address to export metric data.
Creating an OpenTelemetry Protocol (OTLP) Exporter
OpenTelemetry Go requires an exporter to send metrics to a backend. Exporters allow telemetry data to be transferred either to the AWS Distro for OpenTelemetry Collector (ADOT Collector), or to a remote system or console for further analysis. The ADOT Collector is a separate process that is designed to be a "sink" for telemetry data emitted by many processes, which can then export that data to various back-end systems.
To initialize the OTLP metric exporter, add the following code to the file the main.go file.
IMPORTANT: The following examples creates an OTLP exporter that does not encrypt data at transfer because it uses the otlpmetricgrpc.WithInsecure() option. This should only be used for creating proof of concepts and experimenting with the Go SDK.
For production environments you must properly configure TLS using the otlpmetricgrpc.WithTLSCredentials function.
1// Create and start new OTLP metric exporter2metricExporter, err := otlpmetricgrpc.New(ctx, otlpmetricgrpc.WithInsecure(), otlpmetricgrpc.WithEndpoint("0.0.0.0:4317"), otlpmetricgrpc.WithDialOption(grpc.WithBlock()))3if err != nil {4 log.Fatalf("failed to create new OTLP metric exporter: %v", err)5}Creating a Meter Provider
In order to generate metrics, OpenTelemetry Go SDK requires a meter provider to be created. The meter provider is configured with a periodic reader in this example.
To create a new meter provider, add the following lines to the main.go file.
1mp := metric.NewMeterProvider(metric.WithReader(metric.NewPeriodicReader(metricExporter))Above block of code creates a new MeterProvider with a periodic reader.
Setting Global Options
To set up global options for the meter provider, we will use the otel package and add the following line to the main.go file.
1otel.SetMeterProvider(mp)Instrumenting an Application
Visit the OpenTelemetry Go SDK repository for a list of instrumentation packages that OpenTelemetry Go SDK supports to trace various calls (incoming requests, outgoing HTTP calls and SQL calls). Check out the example directory inside each instrumentation package for instrumentation instructions.
Instrumenting the AWS SDK
Run go get go.opentelemetry.io/contrib/instrumentation/github.com/aws/aws-sdk-go-v2/otelaws command to import the AWS SDK v2 instrumentation module. The below example displays AWS SDK v2 instrumentation. Check out the complete AWS SDK v2 instrumentation example.
Note: We currently don't provide support for instrumenting AWS SDK v1 calls.
1tracer := otel.Tracer("demo")2ctx, span := tracer.Start(context.Background(), "AWS SDK instrumentation")3defer span.End()4
5// init aws config6cfg, err := awsConfig.LoadDefaultConfig(ctx)7if err != nil {8 panic("configuration error, " + err.Error())9}10
11// instrument all aws clients12otelaws.AppendMiddlewares(&cfg.APIOptions)13
14// Call to S315s3Client := s3.NewFromConfig(cfg)16input := &s3.ListBucketsInput{}17result, err := s3Client.ListBuckets(ctx, input)18if err != nil {19 fmt.Printf("Got an error retrieving buckets, %v", err)20 return21}Configuring Sampling
By default, the OpenTelemetry Go SDK samples 100% of incoming requests by using AlwaysSample.
Reduce Sampling Rate
To reduce the sampling rate, configure OpenTelemetry Go SDK to use TraceIDRatioBased sampler. Below is the code
snippet to configure the TraceIDRatioBased sampler to sample 10% of requests.
1// initialize the traceIDRatioBasedSampler2 traceIDRatioBasedSampler := trace.TraceIDRatioBased(0.10)3
4 // attach traceIDRatioBasedSampler to tracer provider5 tp := trace.NewTracerProvider(trace.WithSampler(traceIDRatioBasedSampler))Sampling using AWS X-Ray Remote Sampler
AWS X-Ray remote sampler can be initialized using NewRemoteSampler API. NewRemoteSampler can be configured with below options. If AWS X-Ray remote sampler is not able to fetch sampling rules or targets from AWS X-Ray due to networking or config issues(collector) then remote sampler uses fallback sampler. Fallback sampler always samples 1 req/sec and 5% of additional requests during that second. Moreover, remote sampler uses TraceIDRatioBased sampler to enforce Rate set by customers on AWS X-Ray Console after
Reservoir quota is consumed.
NOTE: ctx passed in NewRemoteSampler API is being used in background go routine which serves getSamplingRules and getSamplingTargets API call. So any cancellation in context would also kill the go routine. Ideally, passed context should not be scoped to any kind of startup processes where context is short lived.
| NewRemoteSampler API options | Description | Default Configuration |
|---|---|---|
WithEndpoint(endpoint url.URL) | Endpoint used to communicate with the awsproxy collector extension | http://localhost:2000 |
WithSamplingRulesPollingInterval(interval time.Duration) | Duration between polling of the GetSamplingRules API | 300 seconds |
WithLogger(l logr.Logger) | logging for remote sampler | go-logr/stdr |
1ctx := context.Background()2
3 endpoint, err := url.Parse("http://127.0.0.1:2000"); if err != nil {4 return5 }6
7 // instantiate remote sampler with options8 rs, err := NewRemoteSampler(ctx, "service_name", "cloud_platform", WithEndpoint(endpoint), WithSamplingRulesPollingInterval(350 * time.Second)); if err != nil {9 return10 }11
12 // attach remote sampler to tracer provider13 tp := trace.NewTracerProvider(trace.WithSampler(rs))Custom Instrumentation
Creating Custom Spans
You can use custom spans to monitor the performance of internal activities that are not captured by instrumentation libraries. Note that only spans of kind Server are converted into X-Ray segments, all other spans are converted into X-Ray subsegments. For more on segments and subsegments, see the AWS X-Ray developer guide.
The below example shows how to create custom spans.
1tracer := otel.Tracer("demo")2
3// this span will be translated to a segment in X-Ray backend4ctx, span := tracer.Start(context.Background(), "segment", trace.WithSpanKind(trace.SpanKindServer))5
6// this span will be translated to a subsegment in X-Ray backend7_, span2 := tracer.Start(ctx, "subsegment", trace.WithSpanKind(trace.SpanKindClient))8
9defer span2.End()10defer span.End()Adding custom attributes
You can also add custom key-value pairs as attributes onto your spans. The below example displays how to add attributes to the span. You can convert some or all attributes to annotations via the collector config, and otherwise they are metadata by default. To read more about X-Ray annotations and metadata see the AWS X-Ray Developer Guide.
1var tracer = otel.Tracer("demo")2_, span := tracer.Start(3 context.Background(),4 "DemoExample",5 trace.WithAttributes(attribute.String("a", "1")))6defer span.End()Creating metrics
Similarly to Traces, you can create custom metrics in your application using the OpenTelemetry API and SDK.
In the following example application we demonstrate how to use metric instruments to record metrics with a Counter.
1var meter = otel.Meter("demo")2timeAliveMetric, _ := meter.Int64Counter(3 "time_alive",4 instrument.WithDescription("Total amount of time that the application has been alive"),5 instrument.WithUnit("ms"),6)7go func() {8 for {9 timeAliveMetric.Add(context.Background(), 1000, attribute.String("a", "1")) // in millisconds10 time.Sleep(time.Second * time.Duration(1))11 }12}()Sample Application
See AWS Distro for OpenTelemetry Sample Code with Go SDK for instructions on setting up and using the sample app.