AWS Distro for OpenTelemetry
Metrics on AWS Distro for OpenTelemetry JavaScript SDK
Metrics on AWS Distro for OpenTelemetry JavaScript SDK
Metrics auto instrumentation has not been supported in ADOT/OpenTelemetry yet. We have to manually instrumenting code in the application to generate application metrics. Here is an example with steps for modifying application code to create metrics with JavaScript SDK.
OpenTelemetry JavaScript SDK has provided metrics API for metrics instrumentation in applications. You can follow the steps and sample code below to create OpenTelemetry Metrics and send it over to ADOT Collector.
In this tutorial, we will introduce how to use OpenTelemetry JavaScript SDK for metric instrumentation in the application.
Requirements
Node JS v8.50 (or later) is required to run an application using OpenTelemetry.
Note: You’ll also need to have the AWS Distro for OpenTelemetry Collector running to export metrics to Amazon CloudWatch. See the ADOT Collector documentation for setup instructions.
Getting the SDK and Dependencies
In order to trace your application, the following OpenTelemetry packages will be required to be installed in your applications main directory.
1$ npm install \2 @opentelemetry/api \3 @opentelemetry/sdk-node \4 @opentelemetry/exporter-metrics-otlp-grpc \5 @opentelemetry/sdk-metrics \6 @opentelemetry/api-metricsInstrumenting Code
Once OpenTelemetry Dependencies have been imported to application, we can start to instrument code for creating metrics.
- Initiate OpenTelemetry Metrics exporter to send metrics to ADOT Collector
1const process = require('process');2const opentelemetry = require("@opentelemetry/sdk-node");3const { Resource } = require("@opentelemetry/resources");4const { SemanticResourceAttributes } = require("@opentelemetry/semantic-conventions");5const { PeriodicExportingMetricReader } = require("@opentelemetry/sdk-metrics");6const { OTLPMetricExporter } = require("@opentelemetry/exporter-metrics-otlp-grpc");7
8const _resource = Resource.default().merge(new Resource({9 [SemanticResourceAttributes.SERVICE_NAME]: "js-sample-app",10 }));11}12const _metricReader = new PeriodicExportingMetricReader({13 exporter: new OTLPMetricExporter(),14 exportIntervalMillis: 100015});- Create a OpenTelemetry Metric Provider for initiating metrics
1async function nodeSDKBuilder() {2 const sdk = new opentelemetry.NodeSDK({3 metricReader: _metricReader,4 resource: _resource,5 });6 7 // this enables the API to record telemetry8 await sdk.start(); 9 // gracefully shut down the SDK on process exit10 process.on('SIGTERM', () => {11 sdk.shutdown()12 .then(() => console.log('Metrics terminated'))13 .catch((error) => console.log('Error terminating metrics', error))14 .finally(() => process.exit(0));15 });16}- Define metrics and metric labels(dimensions) for the application In the following example application we demonstrate how to use the three types of metric instruments that are available to record metrics: Counters, Gauges and Histograms.
const metricsApi = require('@opentelemetry/api-metrics');const common_attributes = { signal: 'metric', language: 'javascript', metricType: 'random' };
// acquire meter const meter = metricsApi.metrics.getMeter('js-sample-app-meter');
// synchronous counter metricconst counterExample = meter.createCounter('counter', { description: 'Creates a counter metric', unit: 's'});
// asynchronous updown counter metricconst observableUpdownCounterExample = meter.createObservableUpDownCounter('updownCounter', { description: 'Creates an asynchronous updown counter metric', unit:'1'});observableUpdownCounterExample.addCallback((measurement) => {measurement.observe(counterVar, common_attributes)});
// updates updown counterfunction updateObservableCounter() { counterVar += Math.random() * 100;}const metricsApi = require('@opentelemetry/api-metrics');const common_attributes = { signal: 'metric', language: 'javascript', metricType: 'random' };
// acquire meter const meter = metricsApi.metrics.getMeter('js-sample-app-meter');
// observable gauge metricconst observableGaugeExample = meter.createObservableGauge('observableGauge', { description: 'Creates an observable gauge metric', unit: '1'});observableGaugeExample.addCallback((measurement) => {measurement.observe(gaugeVar, common_attributes)});
// updates observable gaugefunction updateObservableGauge() { gaugeVar = Math.random() * 100;}const metricsApi = require('@opentelemetry/api-metrics');
// acquire meter const meter = metricsApi.metrics.getMeter('js-sample-app-meter');
const histogramExample = meter.createHistogram('histogram', { description: "Creates a histogram metric.", unit: 'ms'});- Send metrics
const common_attributes = { signal: 'metric', language: 'javascript', metricType: 'random' };
// update metricssetInterval(() => { counterExample.add(1, common_attributes); updateObservableCounter(); updateObservableGauge(); histogramExample.record(Math.random() * 1000, common_attributes);}, 1000);These steps provided the sample code for applications to create application metrics.
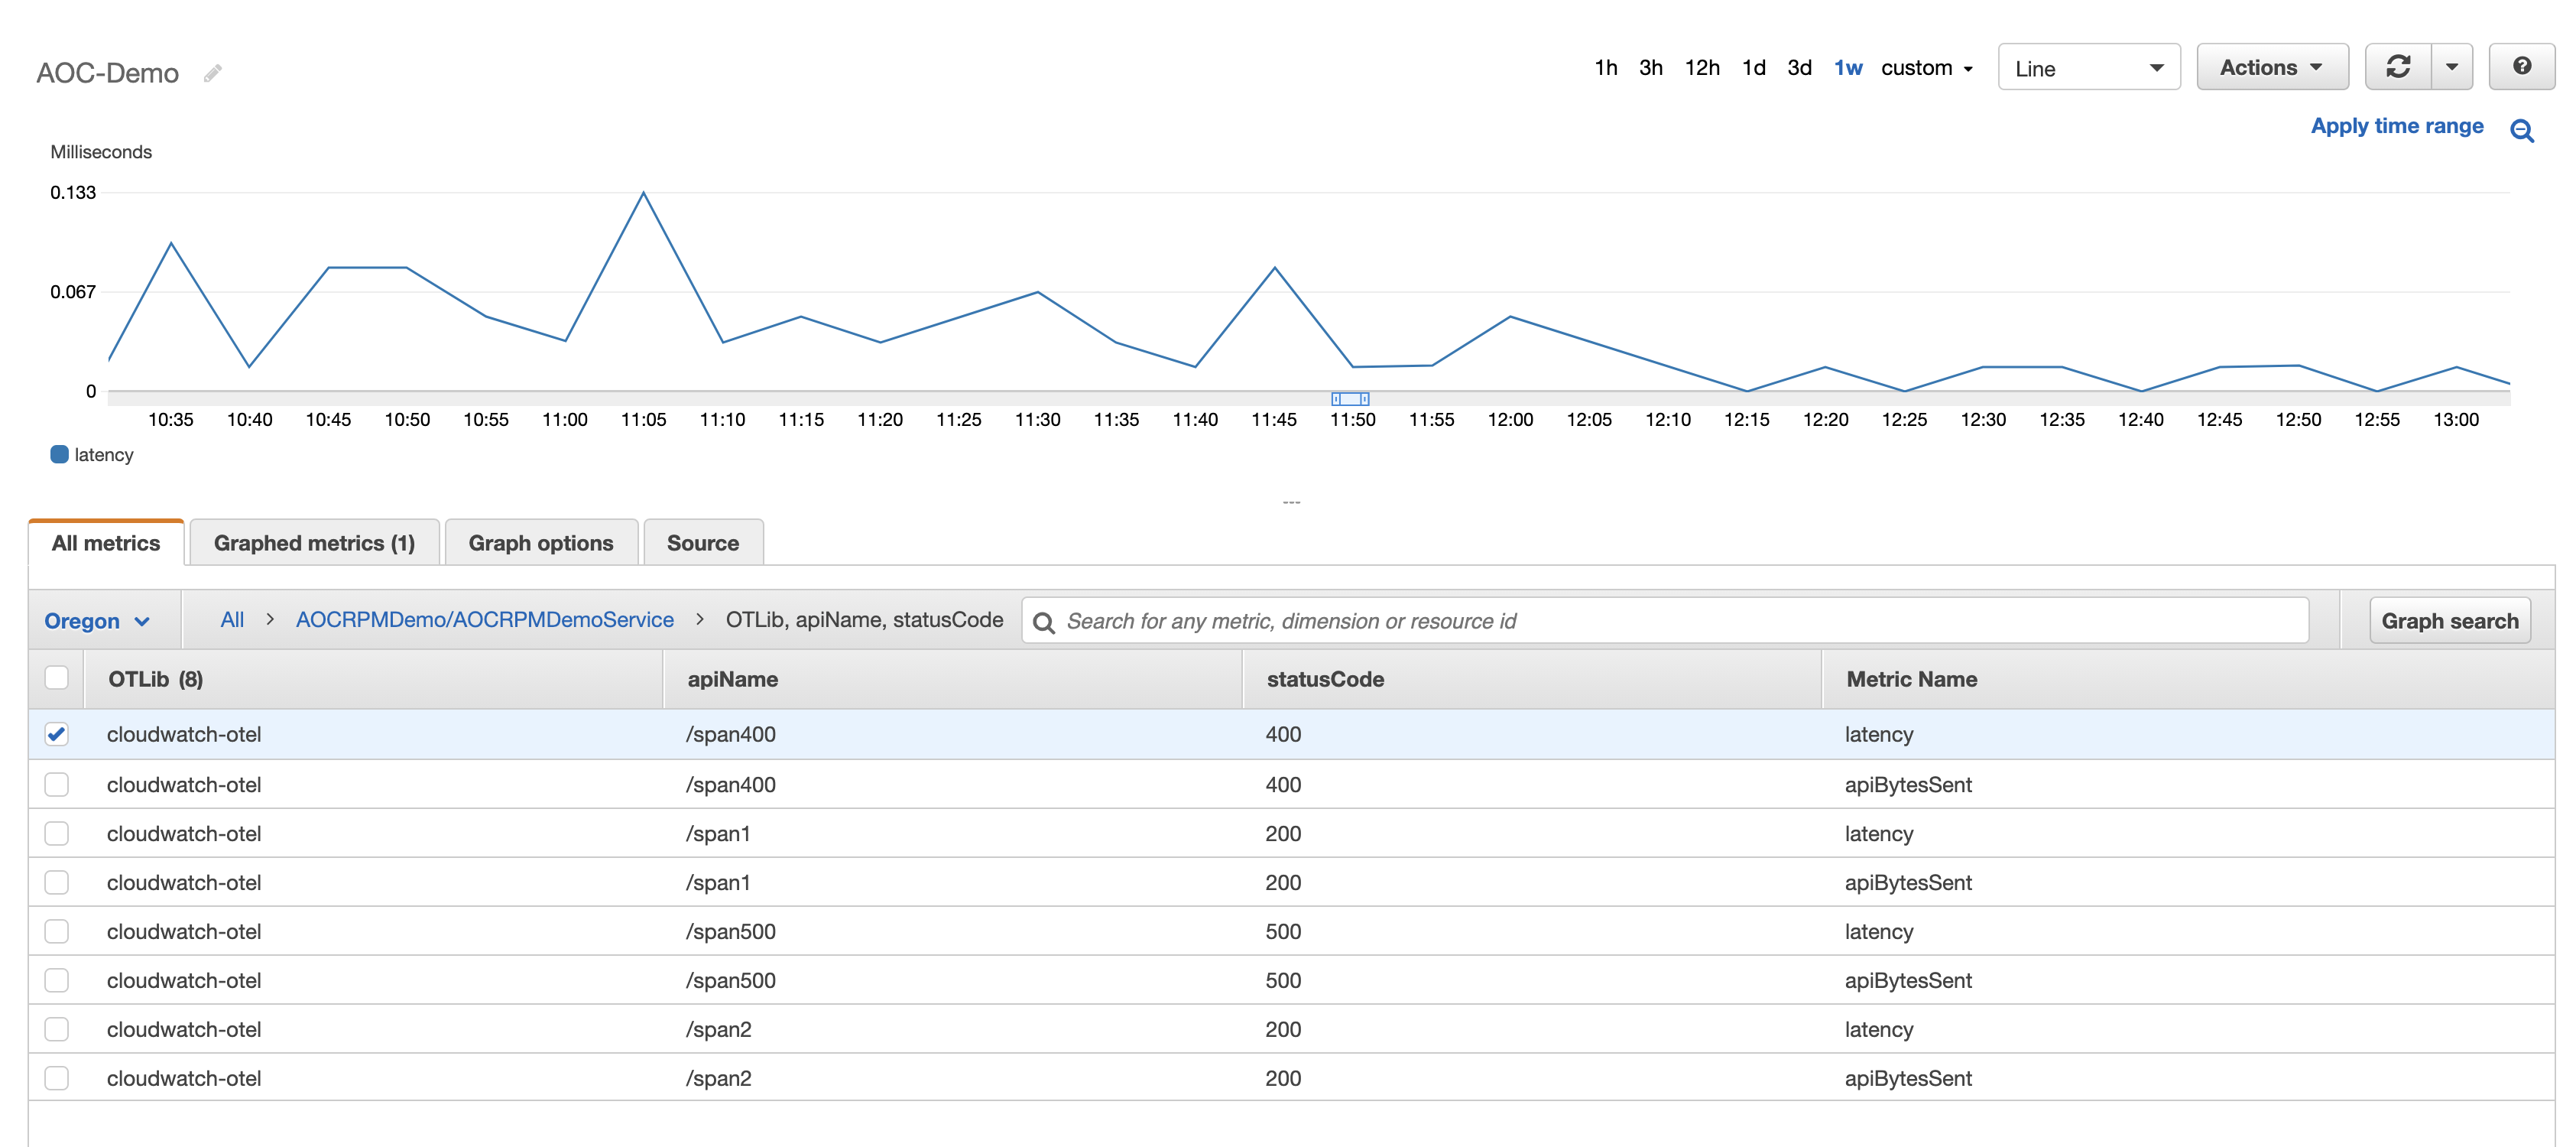
Please follow Getting Started Sending CloudWatch Metrics with AWS OpenTelemetry to setup ADOT Collector for sending metrics to CloudWatch. Once ADOT Collector is installed to collect the metrics data. You should see the following metrics present on your CloudWatch Console.

Please stay tuned to AWS Observability Repo for more updates.