AWS Distro for OpenTelemetry
Basic Kubernetes/EKS Configuration for AMP
Basic Kubernetes/EKS Configuration for AMP
In this guide, we'll enable Prometheus collection for an EKS cluster on EC2 and an EKS cluster on Fargate. In this scenario, we will use the Prometheus Receiver to perform service discovery in an EKS cluster and metric scraping. We will scrape from an application that provides us with some example Prometheus metrics. Notice that this setup will also work for an on-premise Kubernetes configuration.
For information about advanced configurations and how to scrape Kubernetes infrastructure with the ADOT Collector-AMP pipeline, please take a look here
Service Discovery
The Prometheus Receiver can be configured using your existing Prometheus configurations to perform service discovery and metric scraping. There are many possible configurations to discover monitored targets including Kubernetes service discovery (kubernetes_sd_config) and static hosts (static_config). Note that the Prometheus Receiver will scrape metrics in the Prometheus exposition format. Any applications or endpoints that you want to scrape should be configured with the Prometheus client library.
The Prometheus Remote Write Exporter will use the remote_write endpoint to send the scraped metrics to an AMP instance. The HTTPs requests
used to export data will be signed with AWS SigV4, AWS’
authentication protocol for secure authentication. This is done using the sigv4auth extension.
Prerequisites
Before getting started, you will need to set up the following components:
- An AMP workspace should be set up. Guides for this can be found here.
- A Kubernetes or EKS cluster. The EKS cluster can be on either EC2 or Fargate. If you need to set up an EKS cluster, please use the following guide.
You can check the name of the active context/cluster using this command
kubectl config current-context. - If you are setting up the ADOT Collector of AWS EKS, you will need to set up IAM roles for service accounts for the ingestion of metrics from Amazon EKS clusters. Please follow the To set up IRSA for ingestion into AMP section. This section will create a IAM role for the service account that we will use for the ADOT Collector to scrape and export metrics.
Editing the Trust Policy
If you are setting up the ADOT Collector of AWS EKS, you will need to edit the trust policy created in the prerequisites.
- Go to your IAM Management Console to find the amp-iamproxy-ingest-role that was created in the prerequisites.
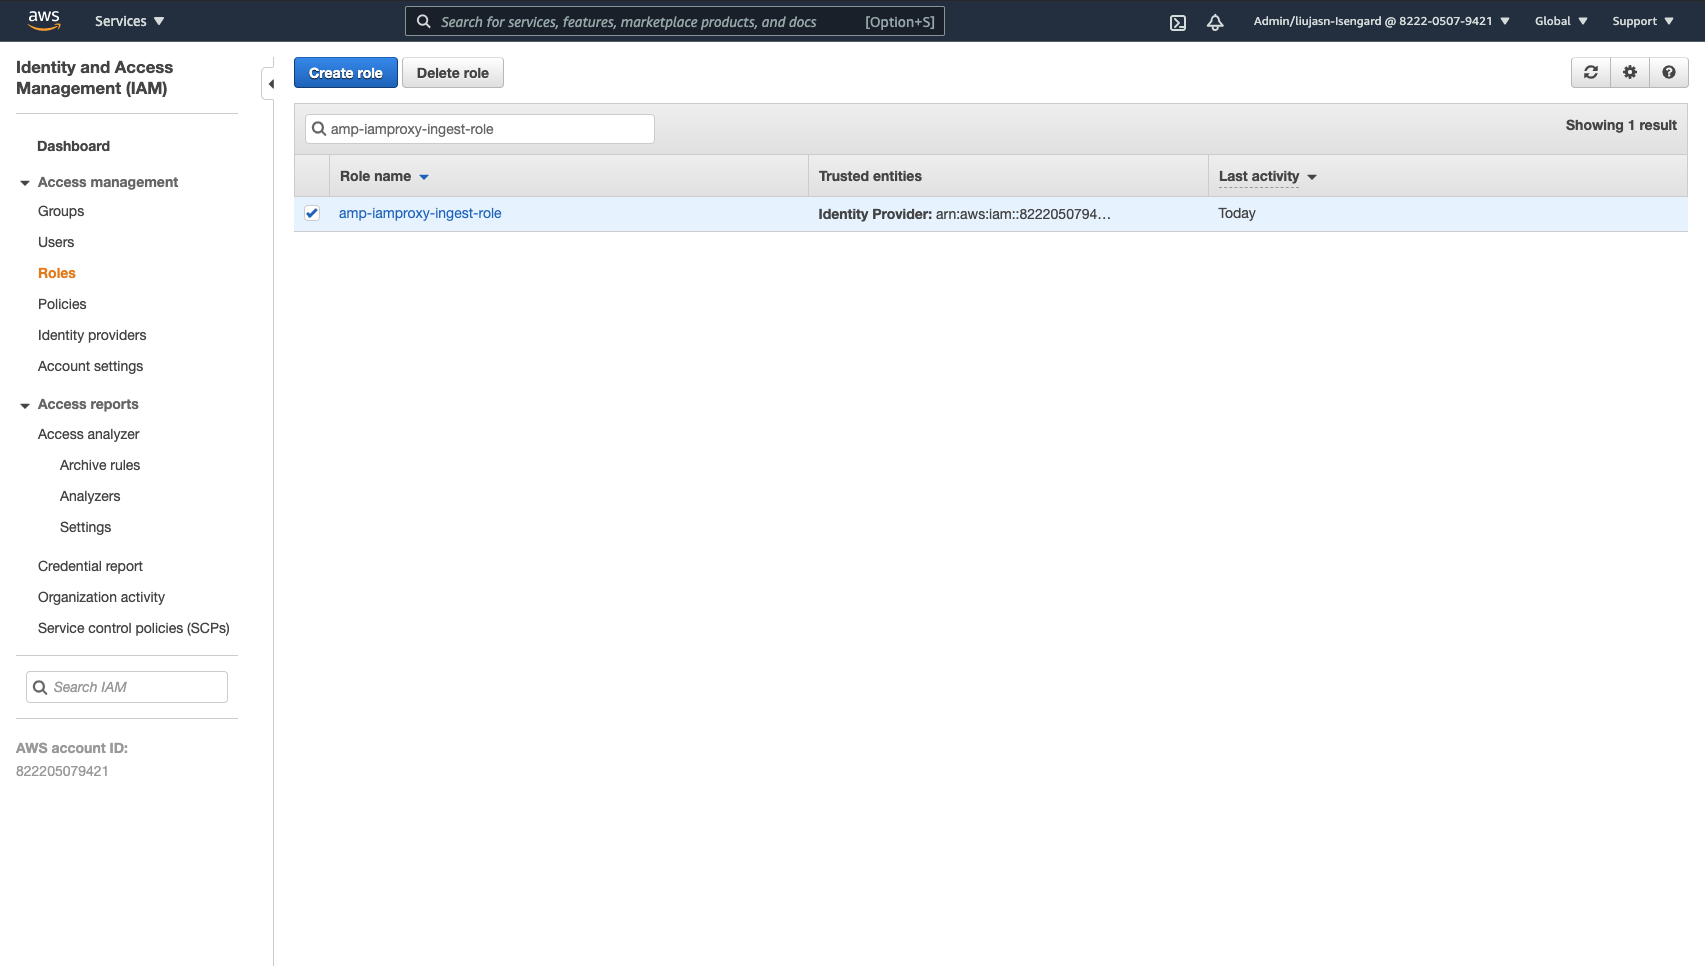
- Go to trust relationships and click Edit trust relationship.
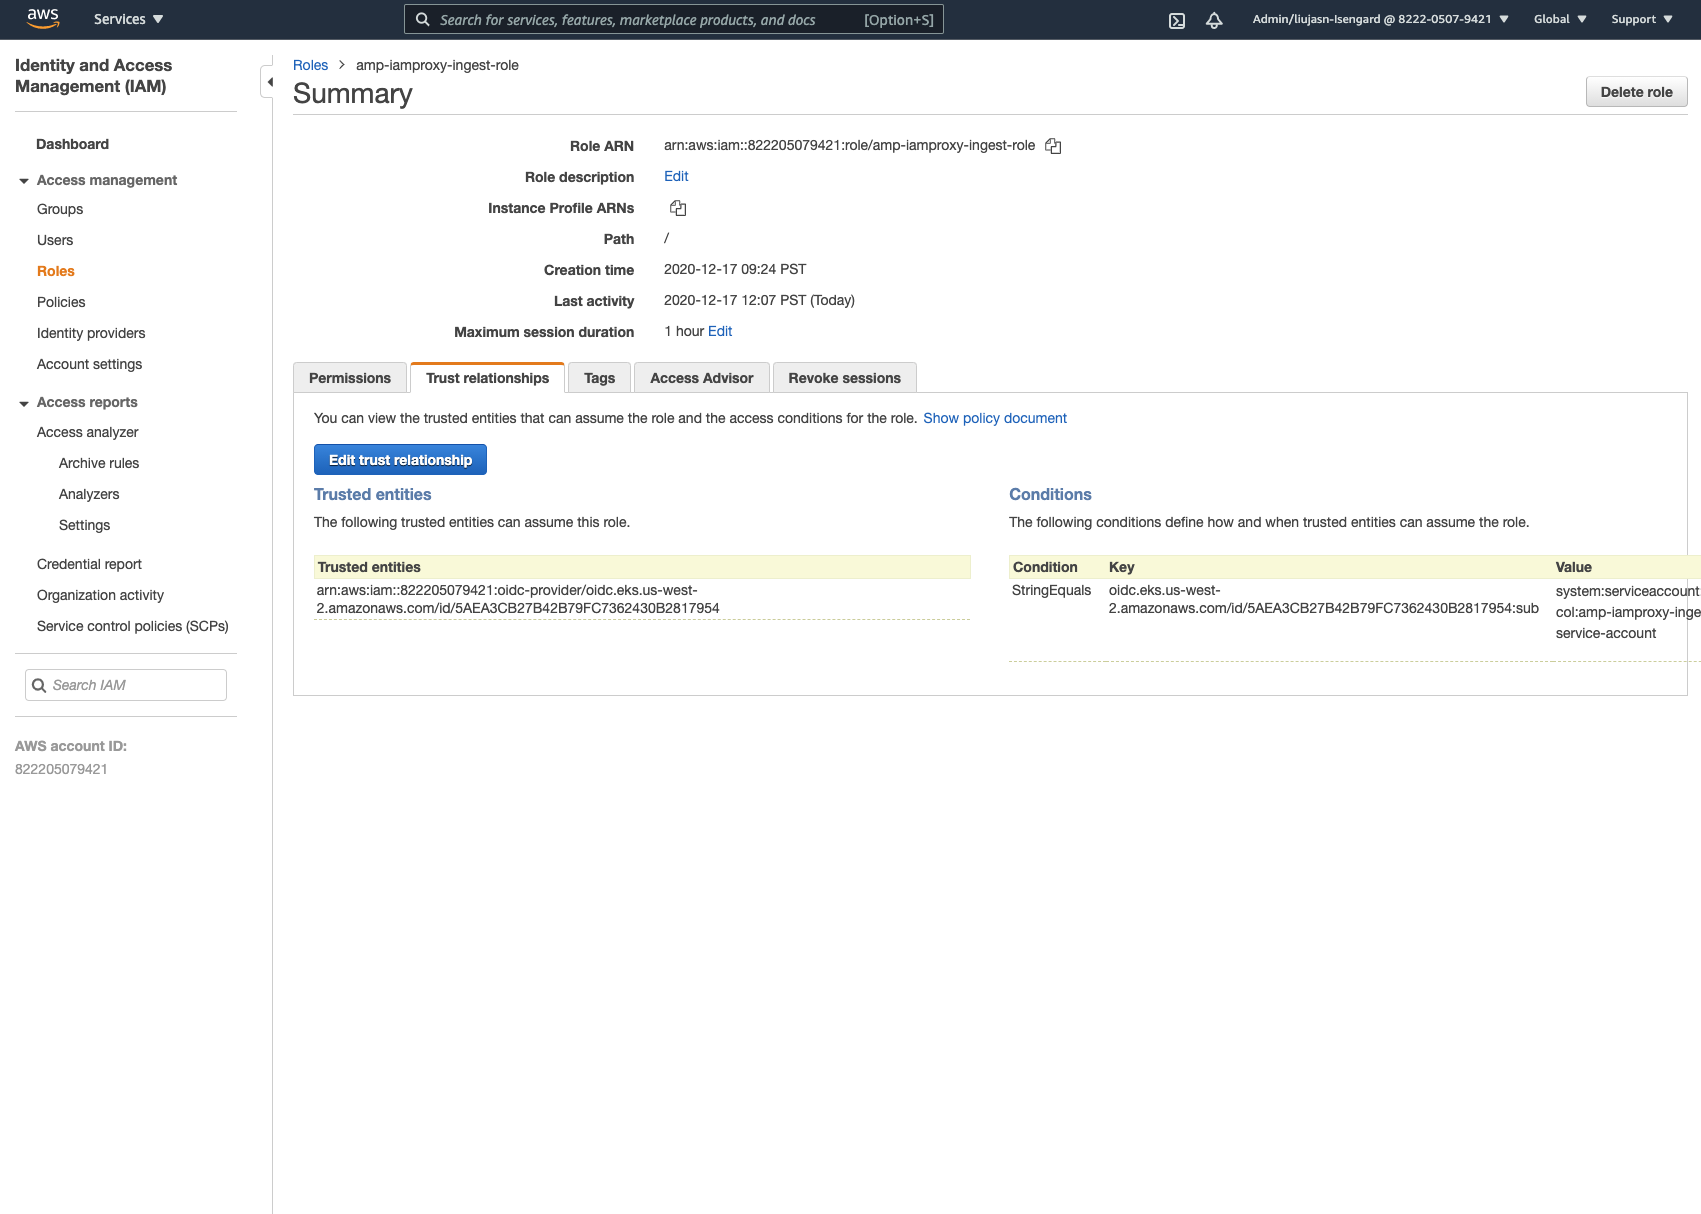
- Locate the string below inside the existing trust policy.
"system:serviceaccount:<your_prometheus_workspace>:amp-iamproxy-ingest-service-account"- Change the namespace for the service account to adot-col. The resulting string should reflect the example below:
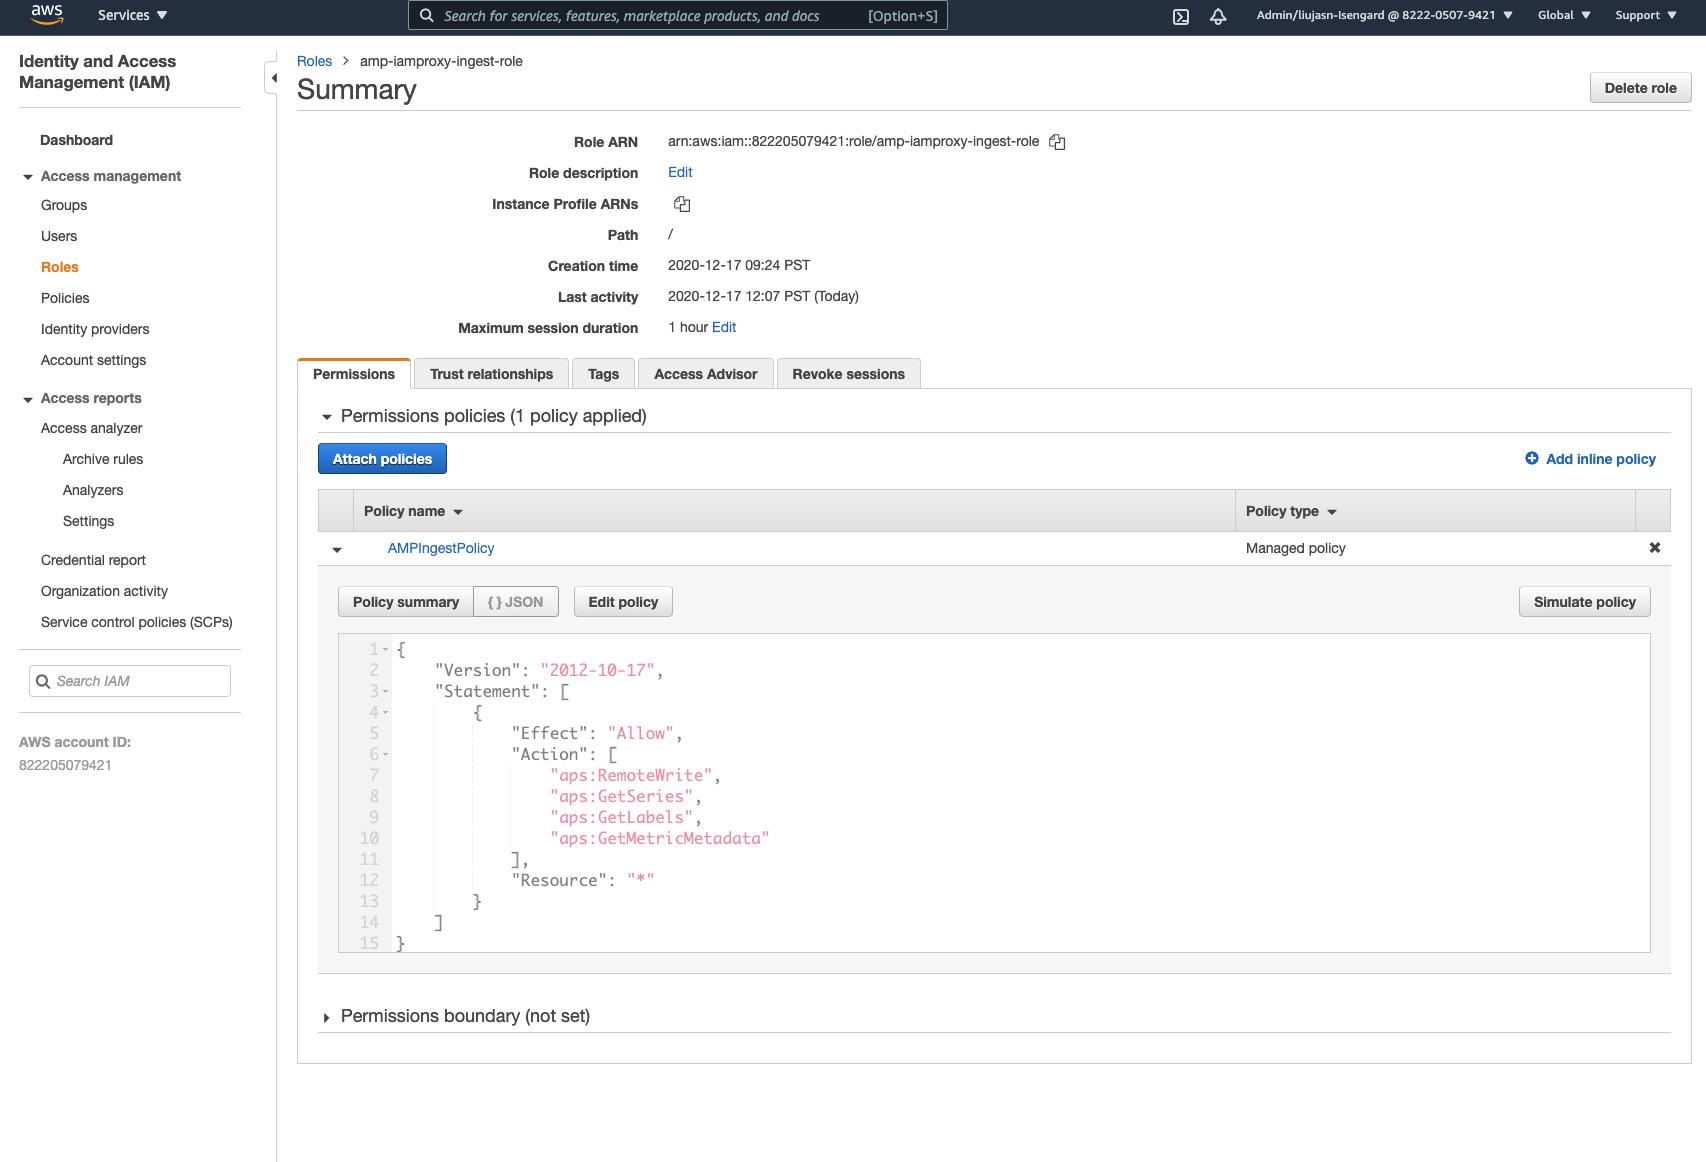
"system:serviceaccount:adot-col:amp-iamproxy-ingest-service-account"- Please make sure the following permissions policy is attached to the IAM role above:
Sample App
We will be using a simple sample app that is used for the integration tests of this pipeline. You can find the sample app here.
First, fork the repository. Then clone the repository and run the following commands:
$ cd ./sample-apps/prometheus-sample-app$ docker build . -t prometheus-sample-app:latestIn order to use this Docker image for Kubernetes, we need to push this image to a registry. You will need to push your image to your Amazon ECR or DockerHub registry.
To deploy the sample app in EKS, copy this Kubernetes configuration and apply it. Make sure to use the latest image that was pushed.
$ curl https://raw.githubusercontent.com/aws-observability/aws-otel-collector/main/examples/eks/aws-prometheus/prometheus-sample-app.yaml -o prometheus-sample-app.yamlAdd your image reference to prometheus-sample-app.yaml
$ kubectl apply -f prometheus-sample-app.yamlYou can use the following command to verify that the sample app has started:
$ kubectl get all -n aoc-prometheus-pipeline-demoNAME READY STATUS RESTARTS AGEpod/prometheus-sample-app-6bfd56b57-8mzsb 1/1 Running 0 15m
NAME TYPE CLUSTER-IP EXTERNAL-IP PORT(S) AGEservice/prometheus-sample-app-service NodePort 10.100.246.31 <none> 8080:31653/TCP 15m
NAME READY UP-TO-DATE AVAILABLE AGEdeployment.apps/prometheus-sample-app 1/1 1 1 15m
NAME DESIRED CURRENT READY AGEreplicaset.apps/prometheus-sample-app-6bfd56b57 1 1 1 15mAny applications that you want to scrape should be instrumented with a Prometheus client
(this exposes Prometheus exposition metrics to a /metrics endpoint). This is done in the sample app as well.
AWS Distro for OpenTelemetry (ADOT) Collector Setup
To start a default instance of the Collector, we have provided an example template configuration. This template will deploy the ADOT Collector as a DaemonSet.
In this example, the ADOT Collector configurations uses Prometheus’s Kubernetes service discovery in order to automatically find the sample app endpoint. An annotation (scrape=true) is used to determine which target endpoints to scrape. (This allows the ADOT Collector to distinguish between our sample app endpoint from kube-system endpoints within your cluster.) Feel free to remove this from the relabel configurations if you would like to scrape a different application.
To pull the Kubernetes configuration for ADOT Collector:
$ curl https://raw.githubusercontent.com/aws-observability/aws-otel-collector/main/examples/eks/aws-prometheus/prometheus-daemonset.yaml -o eks-prometheus-daemonset.yamlYou will have to change the <YOUR_ENDPOINT> and <YOUR_REGION> to correspond with your own AMP workspace. The changes should be with respect to the Prometheus Remote Write Exporter’s configuration and the sigv4auth extension's configuration.
For Example:
1extensions:2 sigv4auth:3 service: "aps"4 region: "us-west-2"5
6exporters:7 prometheusremotewrite:8 endpoint: "https://aps-workspaces.us-west-2.amazonaws.com/workspaces/ws-d26e36bf-361j-480c-94f0-54bd7370f997/api/v1/remote_write"9 auth:10 authenticator: sigv4authYou’ll also need to change <YOUR_ACCOUNT_ID> (in the service account section of the Kubernetes configuration) to your AWS account ID. Now, to deploy the ADOT Collector in EKS, apply this Kubernetes config:
Note: if you are using EKS on Fargate, you will need to change DaemonSet to Deployment. This is because DaemonSets are not supported by Fargate because there is no concept of nodes in Fargate.
$ kubectl apply -f eks-prometheus-daemonset.yamlYou can verify that the ADOT Collector has started with this command:
$ kubectl get pods -n adot-colNAMESPACE NAME READY STATUS RESTARTS AGEadot-col adot-collector-7bc7c 1/1 Running 0 3m17sVerifying the Pipeline Works
The logging exporter can be used to verify that metrics were scraped by the Prometheus Receiver. This example is already hooked up with the logging exporter. You can check the logs with these commands:
$ kubectl get pods -A$ kubectl logs -n adot-col [name_of_your_adot_collector_pod]An example of the scraped metrics in the logging exporter:
Resource labels: -> service.name: STRING(kubernetes-service-endpoints) -> host.name: STRING(192.168.16.238) -> port: STRING(8080) -> scheme: STRING(http)InstrumentationLibraryMetrics #0Metric #0Descriptor: -> Name: test_gauge0 -> Description: This is my gauge -> Unit: -> DataType: DoubleGaugeDoubleDataPoints #0StartTime: 0Timestamp: 1606511460471000000Value: 0.000000In order to test if AMP received those metrics, we can use the awscurl. This tool allows us to send HTTPs requests through the command line with AWS Sigv4 authentication. In order to use this, make sure you have set the correct permissions to query from AMP in your local AWS credentials. Please use this guide to install awscurl.
You can use the following command below to check if a metric was received in AMP. The AMP_REGION and AMP_ENDPOINT will have to be changed
corresponding to your AMP workspace.
$ awscurl --service="aps" --region="AMP_REGION" "https://{AMP_ENDPOINT}/api/v1/query?query=adot_test_gauge0"{"status":"success","data":{"resultType":"vector","result":[{"metric":{"__name__":"adot_test_gauge0"},"value":[1606512592.493,"16.87214000011479"]}]}}Note: we added a namespace: adot value in the ADOT Collector yaml file to prefix each metric that is exported by ADOT Collector with adot_.
It Works!
If you receive a metric as the response, that means your pipeline setup is successful! This metric has successfully propagated from the sample app into AMP.
Similar pipelines can be configured using the components mentioned above to scrape your Kubernetes cluster and applications. Please refer below for advanced configurations.
Cleaning up
Run the following commands to clean up your EKS cluster.
$ kubectl delete namespace aoc-prometheus-pipeline-demo$ kubectl delete namespace adot-col