AWS Distro for OpenTelemetry
Getting Started with ECS Configurations
Getting Started with ECS Configurations
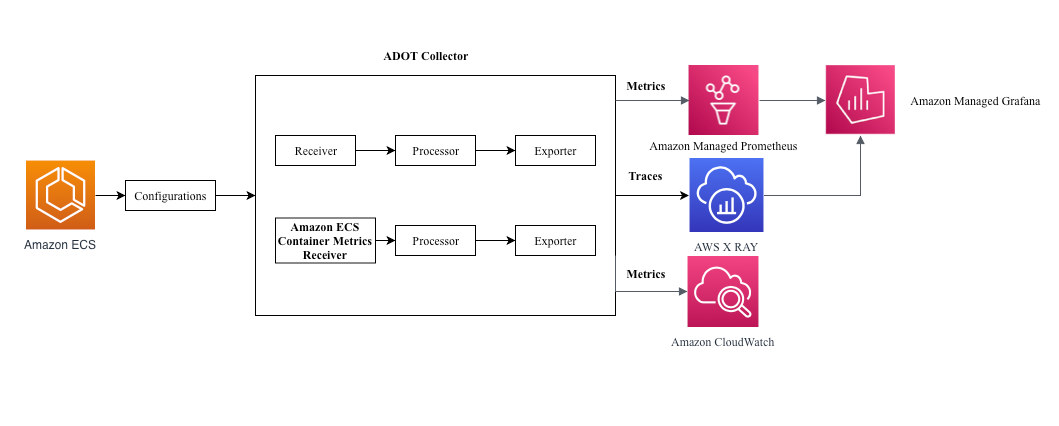
In this tutorial we will provide a step-by-step walk-through of collecting ECS metrics and traces using the ADOT Collector to send to the AWS monitoring service destination of your choice. In this tutorial the monitoring destinations include AWS X-Ray for traces, Amazon CloudWatch, and Amazon Managed Service for Prometheus (AMP) for metrics.
This guide also provides a walk through of the setup and configuration needed for the ADOT Collector to receive and send telemetry data. We will provide an example of the end-to-end data path for ECS and the pipeline to collect and send metrics to Amazon CloudWatch or Amazon Managed Service for Prometheus (AMP), Amazon Managed Grafana (AMG) and send traces to X-Ray.
What is ECS?
Amazon Elastic Container Service (Amazon ECS) is a highly scalable, fast, container management service that makes it easy to run, stop, and manage Docker containers on a cluster of Amazon EC2 instances.
What is ADOT Collector?
AWS Distro for OpenTelemetry Collector (ADOT Collector) is a AWS supported version of the upstream OpenTelemetry Collector. It is fully compatible with AWS computing platforms including EC2, ECS and EKS. It enables users to send telemetry data to Amazon CloudWatch, AWS X-Ray, Amazon Managed Service for Prometheus (AMP), and other services.
End-to-End Data Path for ECS
Types of metrics being collected
The metrics that are listed in the table below are exported from the java-sample-app as an example, however your results may vary depending on your application.
| Metrics | Definition |
|---|---|
| http_server_active_requests | HTTP requests are messages sent by the client to initiate an action on the server |
| http_server_duration_count | The average amount of time it takes for a queried metric to deliver |
| queuesize | Size of HTTP queue requests that provides time for new connections to become available on the server, |
| runtime_jvm_gc_count | Java virtual machine runtime metrics |
| runtime_jvm_gc_time | Java virtual machine runtime metrics |
| runtime_jvm_memory_area | Java virtual machine runtime metrics |
| runtime_jvm_memory_pool | Java virtual machine runtime metrics |
| spansExportedByExporter | Number of spans that are exported by the exporter |
| spansSeenByExporter | Number of spans that are seen by the exporter |
Understanding your Configurations
Configurations
Prerequisites and Configuration Setup Using ECS Console
ECS Console Setup
Questions or Bugs?
Technical documentation is available on the AWS Distro for OpenTelemetry developer site. To learn more about how you can use AWS Distro for OpenTelemetry (ADOT) to collect data for your observability solution, check out the hands-on AWS Observability workshop. Please file an issue if you have questions or request for enhancements in the ADOT distribution, features, or components.