AWS Distro for OpenTelemetry
Migrating from Prometheus to AWS Distro for OpenTelemetry (ADOT)
Migrating from Prometheus to AWS Distro for OpenTelemetry (ADOT)
In this blog we assume that you’re somewhat familiar with Prometheus and are in the process to migrate to an OpenTelemetry-based setup for collecting your metrics. We show the migration steps, discuss how to address compatibility challenges and provide guidance on the usage of the OpenTelemetry setup to collect Prometheus metrics.
Introduction
Prometheus is an open-source systems monitoring and alerting toolkit which simplifies the monitoring and observability of distributed systems, allowing developers and operators to gain insights into their applications' health and performance. It is a widely used tool for collecting and visualizing metrics, known for its operational simplicity.
The AWS Distro for OpenTelemetry (ADOT) collector is an AWS-supported distribution of the OpenTelemetry Collector, a vendor-agnostic component of the OpenTelemetry project. ADOT is a secure, production-ready open-source distribution for use with AWS computing platforms, including Amazon Elastic Kubernetes Service (EKS , Amazon Elastic Container Service (ECS), AWS Lambda and Amazon EC2 . The ADOT collector allows you to collect both traces and metrics with a single agent and ingest them into AWS observability services such as Amazon CloudWatch, AWS X-Ray, Amazon Managed Service for Prometheus (AMP), and Amazon OpenSearch (AOS). To change the telemetry signal destination is as easy as changing the configuration of the ADOT collector.
OpenTelemetry represents a super-set of Prometheus, from a signal perspective by supporting distributed traces, metrics and logs. Traces help us understand how different parts of the system work together and find any issues that might slow things down. By identifying these problem areas, we can make improvements that enhance the overall performance of the system, see this example to diagnose the memory leak using traces and metrics.
Prometheus excels in time series-based monitoring and alerting. OpenTelemetry provides exceptional integration flexibility. It offers exporters and integrations with diverse monitoring and observability systems, effortlessly integrating with existing tools and infrastructure. This empowers organizations to leverage their current monitoring ecosystems, ensuring a smooth transition while minimizing operational complexity.
Steps To Migrate
The migration steps from Prometheus as the collection mechanism to the ADOT collector are as follows.
Prometheus setup
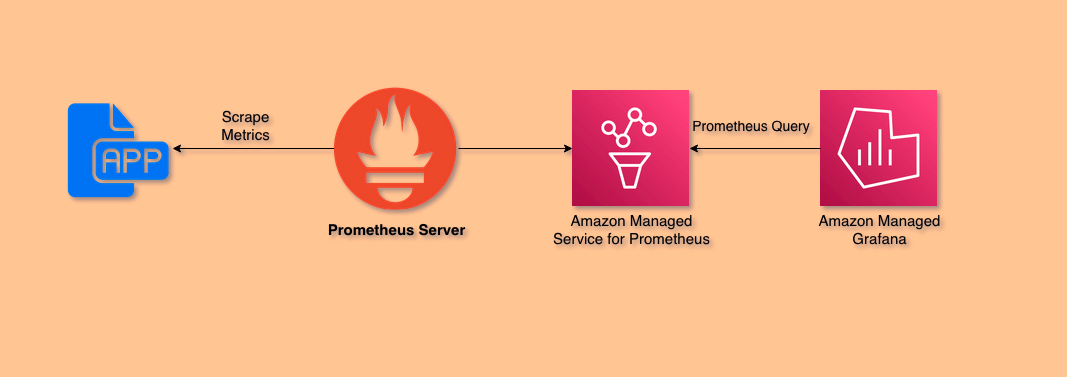
Assess your existing Prometheus configuration, including Prometheus server configuration, scrape configurations, alerting rules, and recording rules. Identify metrics, labels, and configurations that need to be migrated. Let's examine a concrete end-to-end example of a Prometheus server and how it can be configured to remote-write metrics to AMP.
This diagram shows an end-to-end pipeline for scraping the Prometheus metrics using the Prometheus server and remote writing to the monitoring destination Amazon Managed Service for Prometheus, visualizing in Amazon Managed Grafana (AMG).
First, capture the config by saving the following Prometheus configuration as a file named prometheus.yml:
global: scrape_interval: 15s
# Remote writing the exporterremote_write: - url: <YOUR_REMOTE_WRITE_ENDPOINT> sigv4: region: <YOUR_AWS_REGION>
scrape_configs:
# Scraping job using 'static_config' job_name: "Scrape-job" static-config: - targets: [localhost:9001]
# Prometheus self Telemetry - job_name: 'self-telemetry-prometheus' scrape_interval: 5s static_configs: - targets: ["localhost:9090"]Make sure to replace <YOUR_REMOTE_WRITE_ENDPOINT> and <YOUR_AWS_REGION> in the remotewrite .
# Download the prometheus for your platform, modify the url as needed.wget https://github.com/prometheus/prometheus/releases/download/v2.43.0%2Bstringlabels/prometheus-2.43.0+stringlabels.linux-amd64.tar.gz
# Extract the filetar xvfz prometheus-*.tar.gzNavigate to the folder and run the prometheus.
// Navigate inside the extracted prometheus foldercd prometheus-*
// Run Prometheus./prometheus --config.file=prometheus.ymlYou can run Prometheus in agent mode, which is a specialized mode in Prometheus that optimizes it for the remote-write use case. It disables querying, alerting, and local storage, utilizing a customized Time Series Data Base Write Ahead Logs (TSDB WAL) instead. The scraping logic, service discovery, and related configurations remain unchanged:
// Command to run Prometheus in Agent Mode./prometheus --config.file=prometheus.yml --enable-feature=agentTo confirm that the Prometheus server is operational, you can check if it has started up successfully. Verify that Prometheus is serving metrics related to its own performance by accessing
its metrics endpoint -localhost:9090/metrics. Allow a few seconds for Prometheus to collect self-data from its HTTP metrics endpoint and the data is exported to AMP.
You can also run the following awscurl command to check if Amazon Managed Prometheus received the Prometheus metrics data, replace the <YOUR_AWS_REGION> and <YOUR_AMP_WORKSPACE_ID> fields for both queries.
$ awscurl --service="aps" --region="<YOUR_AWS_REGION>" \"https://aps-workspaces..amazonaws.com/workspaces//api/v1/query?query=scrape_duration_seconds"Your output should look something like this:
{"status":"success","data":{"resultType":"vector","result":[{"metric":{"EKS_Container":"cert-manager","EKS_Namespace":"cert-manager","EKS_PodName":"cert-manager-858bf78c95-qvq2j","__name__":"scrape_duration_seconds","app":"cert-manager","app_kubernetes_io_component":"controller","app_kubernetes_io_instance":"cert-manager","app_kubernetes_io_name":"cert-manager","instance":"192.168.41.17:9402","job":"storefront","pod_template_hash":"858bf78c95"},"value":[1636159948.136,"0.001410662"]}]}}ADOT Collector setup
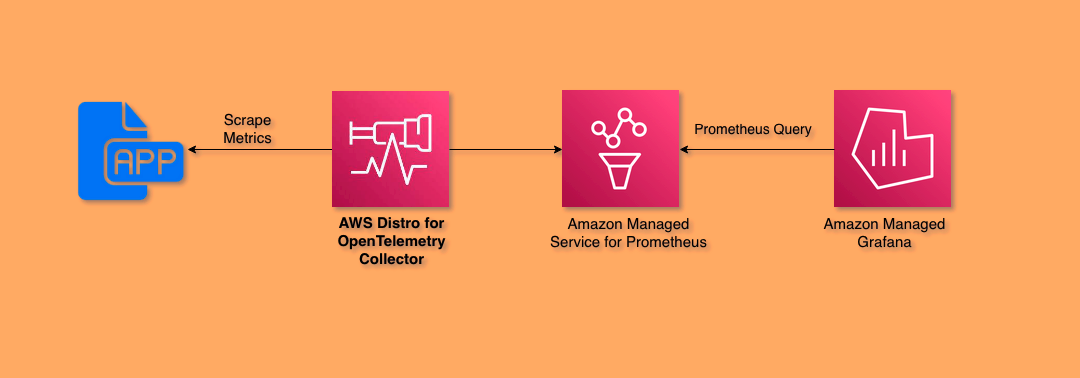
Now, let's understand the OpenTelemetry pipeline and the configuration for using the ADOT collector. This diagram shows an end-to-end pipeline for scraping the Prometheus metrics using the ADOT collector and remote-writing to the monitoring destination AMP, visualizing in AMG.
The following collector configuration, consisting of receivers, processors, and exporters, enables remote achieves the same result as the earlier example of Prometheus server configuration:
extensions: sigv4auth: region: "<YOUR-REGION>"
receivers: prometheus: config: global: scrape_interval: 15s scrape_configs: # Scraping job using 'static_config' - job_name: "Scrape-job" static-config: - targets: [localhost:9001]
processors: batch:
exporters: prometheusremotewrite: endpoint: "<remote-write-endpoint>" auth: authenticator: sigv4auth
service: pipelines: metrics: receivers: [prometheus] processors: [batch] exporters: [prometheusremotewrite] extensions: [sigv4auth]In the ADOT collector, the combination of receivers, processors, extensions, and exporters form a pipeline that handles various tasks to achieve remote writing to AMP. Here's how each component contributes to the overall process:
Receivers: Receivers play the role of collecting telemetry data from from different sources. It serves as the entry point for data and accepts data in a specified format, translates it into the internal format and passes it to processors and exporters defined in the pipeline. Prometheus Receiver collects metrics from various targets and is responsible for scraping metrics from prometheus endpoints, it receives metric data in Prometheus format. It can be configured using your existing Prometheus configurations to perform service discovery and metric scraping. The primary purpose of the Prometheus receiver is to serve as a direct replacement for Prometheus with minimal effort. However, it is important to note that the receiver does not support certain advanced features of Prometheus.
Processors: Processors are optional components and not processors enabled by default. Typically, a processor performs data pre-processing prior to exportation or aids in ensuring that data makes it through a pipeline successfully. To optimize performance, it is strongly recommended to include the batch processor configuration in each collector. The batch processor should be placed in the pipeline after the memory_limiter and any sampling processors that are present. This ensures efficient processing and handling of telemetry data in a controlled manner
Extensions: Extensions enhance the core functionality of the collector by providing additional capabilities. In general, extensions are utilized to implement components that can be seamlessly incorporated into the Collector. The Sigv4AuthExtension here enables Sigv4 authentication a protocol for authenticating inbound API requests to AWS services, for making requests to AWS services. Some examples of extensions include the Health Check extension, which responds to health check requests, and the PProf extension, which enables the retrieval of the Collector's performance profile.
Exporters: Exporters are responsible for sending the processed and transformed data to external systems, such as Prometheus Remote Write exporter in this case, it sends metrics to a remote write destination compatible with the Prometheus remote write API by using the remote_write endpoint. The HTTPS requests used to export data will be signed with AWS SigV4, using the sigv4auth extension.
The ADOT collector is constructed with a preconfigured setup that adheres to a default configuration. The configuration of the ADOT collector follows the same syntax and design as the OpenTelemetry Collector.
Design migration strategy
Plan your migration strategy based on your specific requirements. Consider factors such as the scope of the migration, the metrics you want to migrate, any customizations or transformations needed, and the timeline for the migration. It is important that you are aware of the following compatibility challenges when you plan your migration.
Metric Relabeling - When writing
relabel_configsin the collector config prometheusreceiver one can not use$but has to use$$. If you have existing Prometheus configurations, you will need to replace the $ characters with $$ to avoid having the value replaced with environment variables. This is especially important for the replacement value of the relabel_configurations. For instance, the following configuration for relabel_configs below```relabel_configs:- source_labels: [__meta_kubernetes_ingress_scheme,__address__,__meta_kubernetes_ingress_path]regex: (.+);(.+);(.+)replacement: ${1}://${2}${3}target_label: __param_target```would become
```relabel_configs:- source_labels: [__meta_kubernetes_ingress_scheme,__address__,__meta_kubernetes_ingress_path]regex: (.+);(.+);(.+)replacement: $${1}://$${2}$${3}target_label: __param_target```Retrying in 5xx error - The Prometheus Remote Write exporter has a limitation in the ADOT collector as it does not retry on 5xx error codes. It is currently treating it in the same way as 4xx codes and hence leading to failures in compliance test of Prometheus conformance program. This issue can have implications for data reliability and consistency when using the Prometheus remote write functionality. It may result in data loss or gaps in the exported metrics if the exporter does not handle server errors appropriately. Enable debug logging and logging exporter with
verbosity:detailedin your collector configuration, analyze the logs to understand if the exporter is failed to retry on 5xx errors.Batch Size of Prometheus Remote Write Exporter - The Prometheus Remote Write exporter has a batch size limit that restricts the number of samples in each batch sent to a remote write endpoint. The limit can vary based on prometheus time series data and configuration as well. If the sample count exceeds the limit, data is split into multiple batches. Optimize data transmission efficiency and performance by considering the batch size limit.
Monitor and optimize
TIP: We have a dedicated section on operating the ADOT collector at scale in the AWS Observability Best Practices site.
The ADOT collector generates its own telemetry that providing insights into its performance to leverage its built-in capabilities that helps to optimize your metrics collection, Monitor metrics such as CPU and memory usage, ingestion rate, and queue size to ensure the Collector is operating efficiently.
Configure the telemetry under the service as shown below in your configuration to gain valuable insights and take prompt action.
service: telemetry: logs: level: debug metrics: level: detailed address: 0.0.0.0:8888One should enable self telemetry in their collector and consider ways to scale the pipeline as your telemetry collection increases. When it comes to the Prometheus receiver, for example,
if the duration it takes to complete scraping all targets (measured by scrape_duration_seconds) approaches the scrape_interval you defined in the configuration, It is crucial to consider scaling or
sharding the scraping process. This involves adding more scrapers, typically in the form of new Collector instances.
Also, metrics associated with exporter queue sizes can be highly informative. Specifically, the metrics otelcol_exporter_queue_capacity and otelcol_exporter_queue_size can provide valuable indicators.
Workers are concurrent goroutines that execute tasks concurrently to achieve parallelism and efficient utilization of system resources, collector temporarily holds data in memory until a
worker becomes available to transmit the data.
Insufficient worker availability or slow backend systems can result in a backlog of data accumulating in the queue. When the queue reaches its capacity (otelcol_exporter_queue_size > otelcol_exporter_queue_capacity),
data gets rejected (otelcol_exporter_enqueue_failed_metric_points). See also Scaling the Collector.
Consistently monitor and enhance your OpenTelemetry deployment by making necessary adjustments and fine-tuning the configuration. Lets say you are seeing a high resource (CPU/Memory) utilization of the collector when scraping 70k samples when using the basic configuration referred earlier in the guide, you can configure batch processor to enhance data compression and minimize the quantity of outgoing connections
extensions: sigv4auth: region: "us-west-2"
receivers: prometheus: config: global: scrape_interval: 15s scrape_configs: - job_name: "Scrape-job" static-config: - targets: [localhost:9001]
#configured batch processorprocessors: batch: send_batch_max_size: 70000 timeout: 1s
exporters: prometheusremotewrite: endpoint: "<remote-write-endpoint>" auth: authenticator: sigv4auth
service: pipelines: metrics: receivers: [prometheus] processors: [batch] exporters: [prometheusremotewrite] extensions: [sigv4auth]The following graph illustrates the memory and cpu usage of ADOT collector with default configuration (green) and configured batch processor (yellow) at 70,000, memory consumption of the collector with custom configuration is low and stable, while the collector may consume a bit more CPU than before:
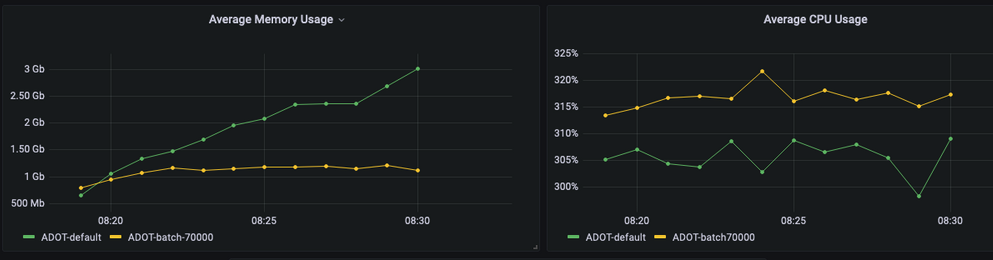
Comparing the ADOT collector and Prometheus in agent mode, the ADOT collector exhibits better memory performance for workloads up to 70k samples per instance. This advantage holds true across various scenarios, including load testing, varying metric-count/series count ratio, and scraping from multiple endpoints with default configurations. Notably, the queue size of the ADOT Collector increases over time. However, it's important to acknowledge that the ADOT collector consumes more CPU than Prometheus in all scenarios, even when Prometheus operates in agent mode.
Demo
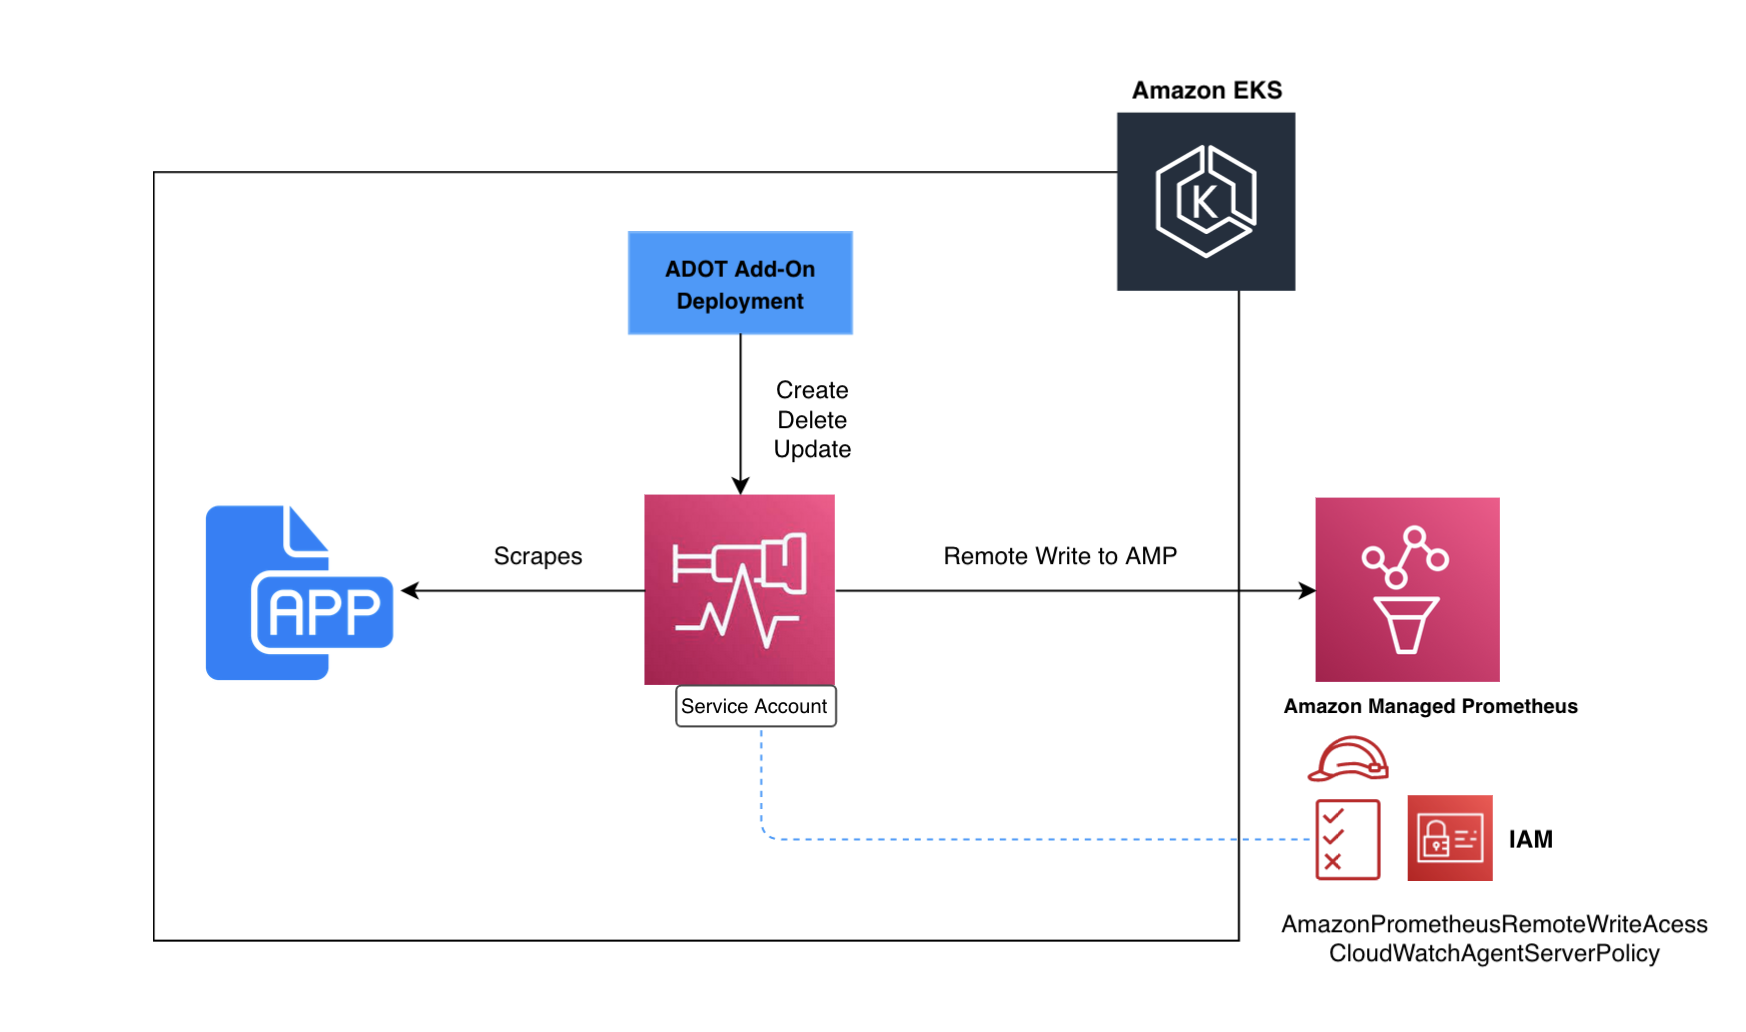
This demonstration showcases the utilization of the ADOT EKS add-on to deploy the OpenTelemetry Operator onto an Amazon EKS cluster.
Throughout this process, the metrics gathered from a Prometheus sample application are collected and exported to the AMP monitoring destination. Subsequently, these metrics are visualized in Grafana. The add-on watches for a custom resource named OpenTelemetryCollector
and manages the lifecycle of an ADOT collector based on the configuration settings specified in the custom resource. The following figure shows an illustration of how this works:
Prerequisites
- The AWS CLI v2 is installed and configured in your environment.
- You need to install the eksctl command in your environment
- You need to install kubectl in your environment.
- You have docker installed into your environment.
Setup
- You can either use an existing EKS cluster or create one using cluster-config.yaml.
Edit the template file and set <YOUR_REGION> and the version to
1.26or any of Amazon EKS Kubernetes versions. - Install cert-manager with the command:
- kubectl apply -f https://github.com/cert-manager/cert-manager/releases/download/v1.12.1/cert-manager.yaml
- Check that cert-manager is ready with the following command:
- kubectl get pod -w -n cert-manager
- Create Amazon Managed Prometheus console using the console: https://console.aws.amazon.com/prometheus/home
- Create AMG workspace using the Amazon Managed Grafana – Getting Started guide.
- Add "Amazon Managed Service for Prometheus" as a datasource during creation.
Deploy sample application
In this demo we will be using prometheus-sample-app from the aws-otel-community repository. This Prometheus sample app generates all four Prometheus metric types (counter, gauge, histogram, summary) and exposes them at the /metrics endpoint.
To build the container image, first clone the Git repository and change into the directory as follows:
git clone https://github.com/aws-observability/aws-otel-community.git && \cd aws-otel-community/sample-apps/prometheus-sample-app/ && \docker build . -t "prometheus-sample-app"Now that the image is built, tag and push the docker image to your ECR repo by following this documentation.
Edit prometheus-sample-app.yaml to contain your ECR image path and any other configurations in the file with your own values:
Now you can deploy the sample app to your cluster using the following command:
kubectl apply -f prometheus-sample-app.yamlYou can associate your IAM role to your EKS service account using IRSA. Your service account can then provide AWS permissions to the containers you run in any pod that use that service account. You must use this command for each cluster where you're installing ADOT to grant your AWS service account permissions. Follow these steps to associate your IAM role to your EKS service account using IRSA.
eksctl create iamserviceaccount \ --name adot-collector \ --namespace aws-otel-eks \ --cluster <your_cluster_name> \ --attach-policy-arn arn:aws:iam::aws:policy/AmazonPrometheusRemoteWriteAccess \ --attach-policy-arn arn:aws:iam::aws:policy/AWSXrayWriteOnlyAccess \ --attach-policy-arn arn:aws:iam::aws:policy/CloudWatchAgentServerPolicy \ --approve \ --override-existing-serviceaccountsWe will see in our collector configurations in later sections that we add the serviceAccount: adot-collector field to our configuration to use IRSA.
EKS add-on now provides the ability to configure ADOT during installation time. With this functionality, an ADOT Collector can also be deployed during an installation like below.
Create
configuration-values.jsonwith the following contents. Replace<YOUR_REMOTE_WRITE_ENDPOINT>with your own:{"collector": {"serviceAccount": {"create": false,"name": "adot-collector"},"amp": {"enabled": true,"remoteWriteEndpoint": "<YOUR_REMOTE_WRITE_ENDPOINT>"}}}Run the following command. Replace <your_cluster_name> with your own.
aws eks create-addon \--cluster-name <your_cluster_name> \--addon-name adot \--addon-version v0.76.1-eksbuild.1 \--configuration-values file://configuration-values.jsonVerify that ADOT add-on is installed and running with the command:
aws eks describe-addon --addon-name adot --cluster-name <your_cluster_name>
You'll see "status": "ACTIVE" when creation is complete. Note that collector may take up to 2 minutes to create and show up in your cluster.
Alternatively, If you wish to have complete control you can Install the ADOT Operator into your Amazon EKS cluster using the following command and deploy collector:
aws eks create-addon --addon-name adot --cluster-name <your_cluster_name>The collector configuration deployment template below allows you to manage everything on your own which also creates ClusterRole and ClusterRoleBinding to provide necessary permissions for the prometheus receiver during service discovery. Save this into a file called collector-config-amp.yaml .
Click here to expand the collector configuration
## OpenTelemetry Collector configuration# Metrics pipeline with Prometheus Receiver and Prometheus Remote Write Exporter sending metrics to Amazon Managed Prometheus## create namespaceapiVersion: v1kind: Namespacemetadata: name: aws-otel-eks labels: name: aws-otel-eks
---# create cwagent service account and role bindingapiVersion: v1kind: ServiceAccountmetadata: name: adot-collector namespace: aws-otel-eks
---apiVersion: opentelemetry.io/v1alpha1kind: OpenTelemetryCollectormetadata: name: my-collector-amp namespace: aws-otel-eksspec: mode: deployment serviceAccount: adot-collector podAnnotations: prometheus.io/scrape: 'true' prometheus.io/port: '8888' config: | extensions: sigv4auth: region: <YOUR_AWS_REGION> service: "aps"
receivers: # # Scrape configuration for the Prometheus Receiver # This is the same configuration used when Prometheus is installed using the community Helm chart # prometheus: config: global: scrape_interval: 15s scrape_timeout: 10s
scrape_configs: - job_name: 'collector-scraping' kubernetes_sd_configs: - role: pod
processors: batch/metrics: timeout: 60s
exporters: prometheusremotewrite: endpoint: "<YOUR_REMOTE_WRITE_ENDPOINT>" auth: authenticator: sigv4auth
service: extensions: [sigv4auth] pipelines: metrics: receivers: [prometheus] processors: [batch/metrics] exporters: [prometheusremotewrite]
---apiVersion: rbac.authorization.k8s.io/v1kind: ClusterRolemetadata: name: otel-prometheus-role namespace: aws-otel-eksrules: - apiGroups: - "" resources: - nodes - nodes/proxy - services - endpoints - pods verbs: - get - list - watch - apiGroups: - extensions resources: - ingresses verbs: - get - list - watch - nonResourceURLs: - /metrics verbs: - get
---apiVersion: rbac.authorization.k8s.io/v1kind: ClusterRoleBindingmetadata: name: otel-prometheus-role-bindingroleRef: apiGroup: rbac.authorization.k8s.io kind: ClusterRole name: otel-prometheus-rolesubjects: - kind: ServiceAccount name: adot-collector namespace: aws-otel-eksTo deploy your collector, make sure to replace <YOUR_REMOTE_WRITE_ENDPOINT> in the prometheusremoterwite exporter config, and <YOUR_AWS_REGION> in the sigv4auth extension config, as per your own target environment and execute the following command :
kubectl apply -f collector-config-amp.yamlVerify that the metrics are successfully collected by the ADOT Collector and exported to the intended destinations. Run the following command to check if Amazon Managed Prometheus received the Prometheus metrics data scrape_duration_seconds.
awscurl --service="aps" --region="<YOUR_AWS_REGION>" \"https://aps-workspaces.<YOUR_AWS_REGION>.amazonaws.com/workspaces/<YOUR_AMP_WORKSPACE_ID>/api/v1/query?query=scrape_duration_seconds"Make sure to replace the <YOUR_AWS_REGION> and <YOUR_AMP_WORKSPACE_ID> fields for both queries. Your output should look something like this:
{"status":"success","data":{"resultType":"vector","result":[{"metric":{"EKS_Container":"cert-manager","EKS_Namespace":"cert-manager","EKS_PodName":"cert-manager-858bf78c95-qvq2j","__name__":"scrape_duration_seconds","app":"cert-manager","app_kubernetes_io_component":"controller","app_kubernetes_io_instance":"cert-manager","app_kubernetes_io_name":"cert-manager","instance":"192.168.41.17:9402","job":"storefront","pod_template_hash":"858bf78c95"},"value":[1636159948.136,"0.001410662"]}]}}This image below represents the metrics collected from Prometheus sample app and exported to monitoring destination AMP and visualized in AMG:
To ensure a smooth migration process from Prometheus to OpenTelemetry, it is essential to leverage the official OpenTelemetry documentation. Detailed technical documentation is available on the ADOT Website, and you can download the distribution from GitHub. You can also download the latest ADOT collector image from the Amazon Elastic Container Registry (ECR) Public Gallery.
To learn more about how to use ADOT to collect data for your observability solution, check out the hands-on AWS Observability workshop and AWS Observability Accelerator. Please file an issue if you have questions or feedback on migrating your Prometheus setup to OpenTelemetry.