AWS Distro for OpenTelemetry
Install ADOT Collector By Creating Task Definition Through AWS Console
Install ADOT Collector By Creating Task Definition Through AWS Console
In this tutorial, we will demonstrate how to install ADOT Collector using Task Definition on the Amazon Elastic Container Service (Amazon ECS) through AWS console.
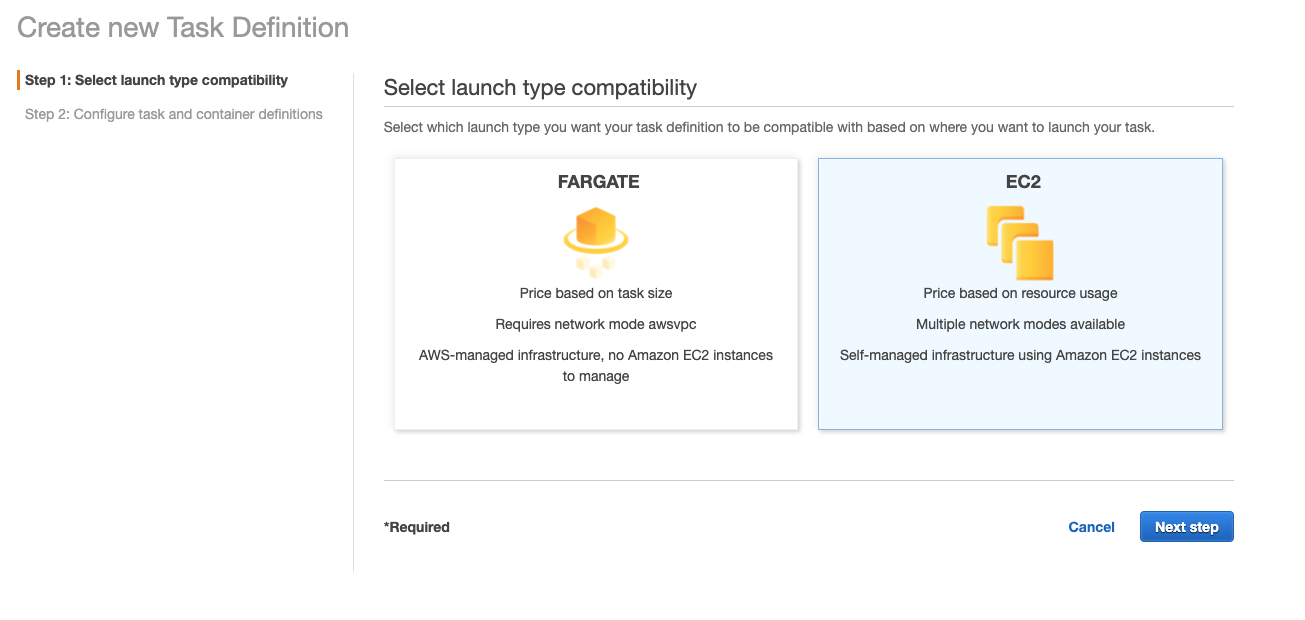
Go to AWS Management Console and select Elastic Container Service. From the left side navigation, select Task Definitions and click the Create new Task Definition button.
Select FARGATE or EC2 as the Launch type and move forward.
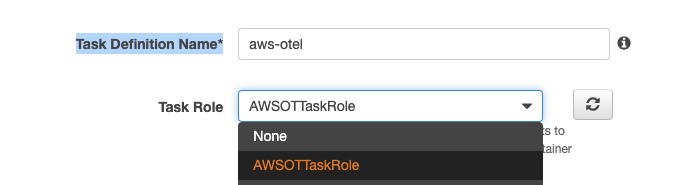
- Put a task-definition name (i.e.aws-otel). And select the role you create in pre section from Taskrole drop-down menu.
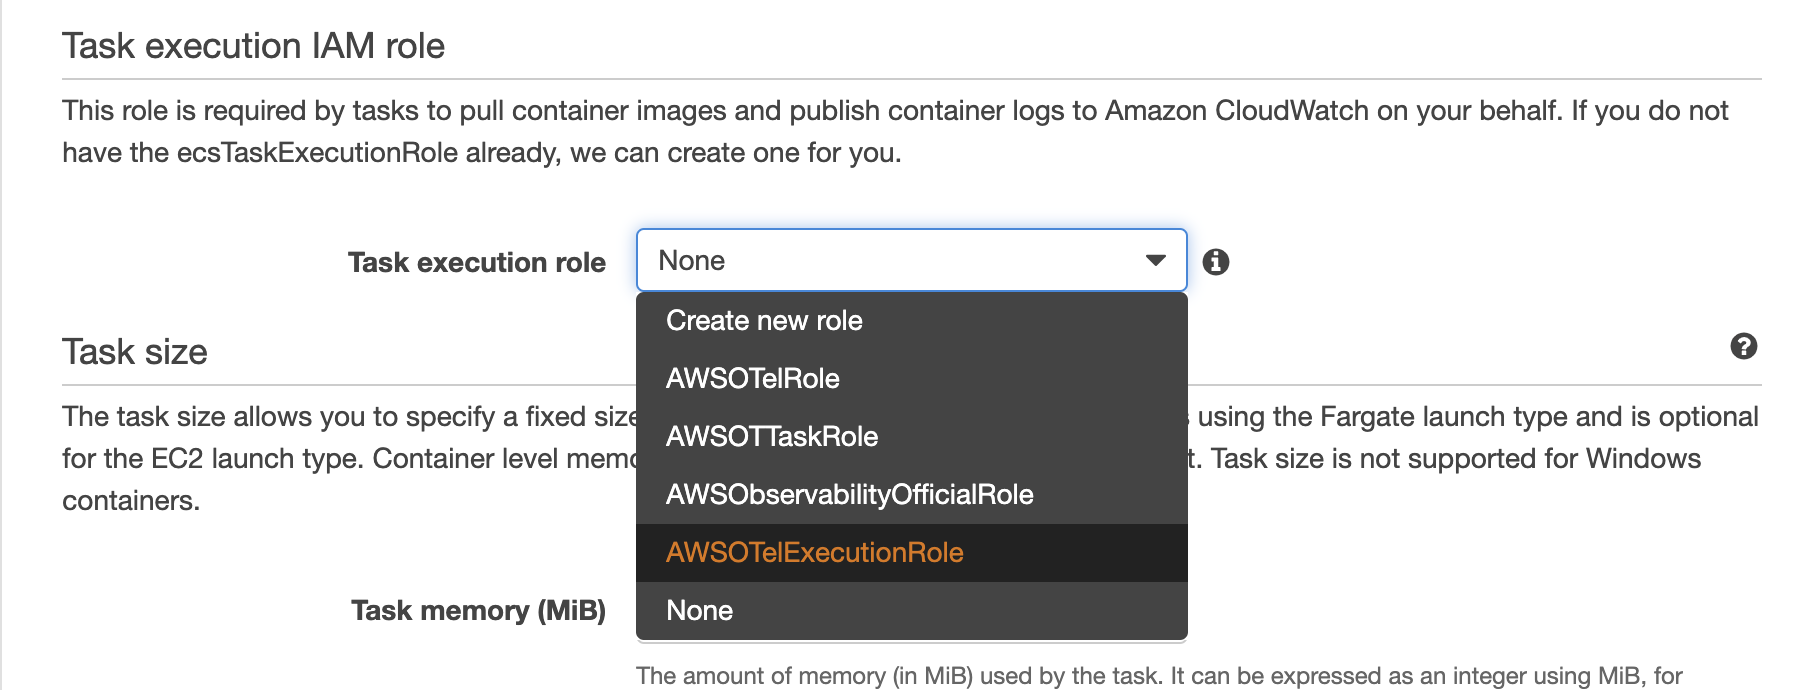
- For the task execution role, select the role name you created by clicking Task execution role drop-down menu.
 Select Network Mode to `awsvpc`
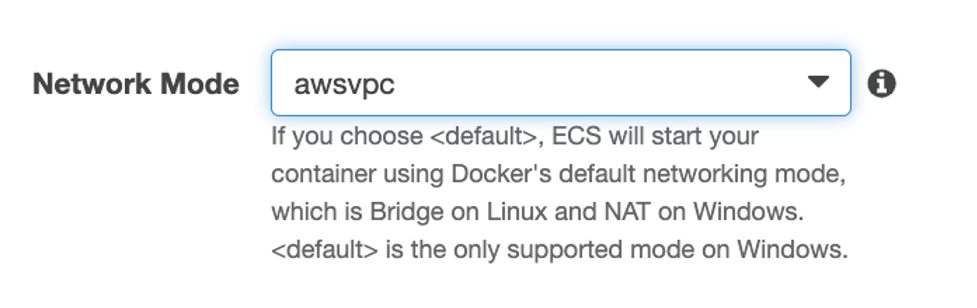
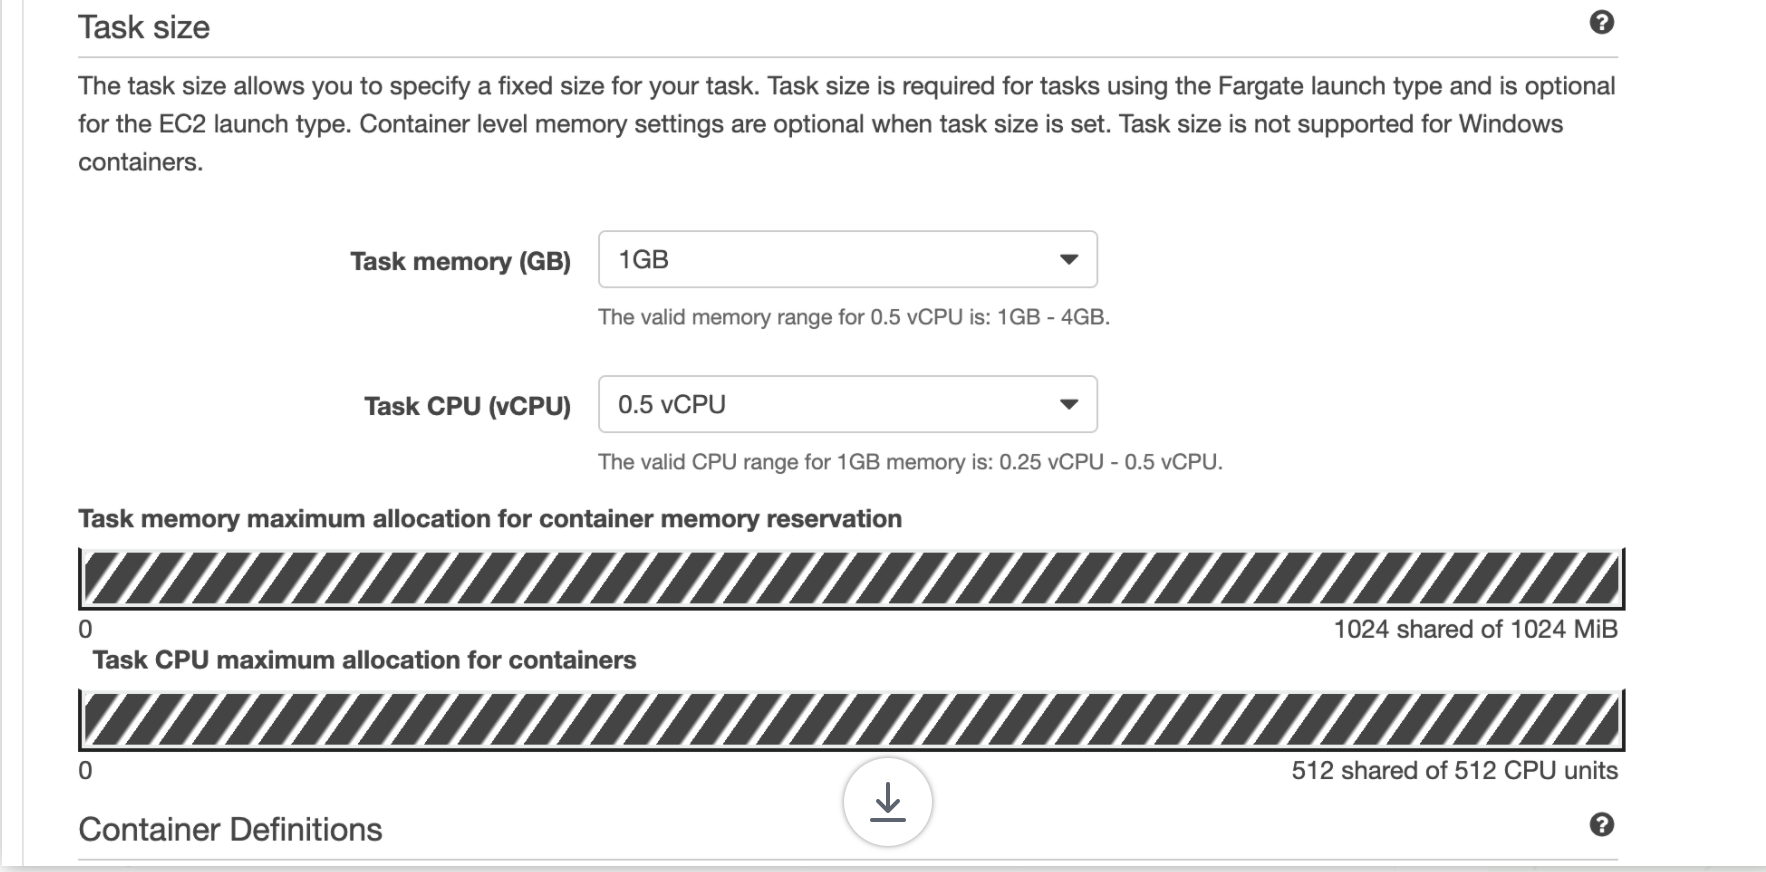
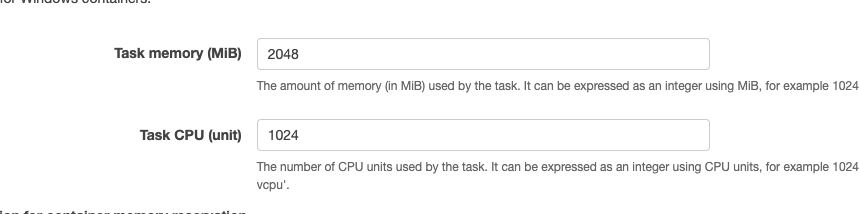
- Select the Task size:
- For ECS FARGATE launch type (slected in step 2), Mention task memory and cpu for your task-definition (This example uses 1GB, 0.5 vCPU).
- For ECS EC2 launch type (slected in step 2), Mention task memory and task cpu for your task-definition like use 2048 for memory, 1024 for CPU
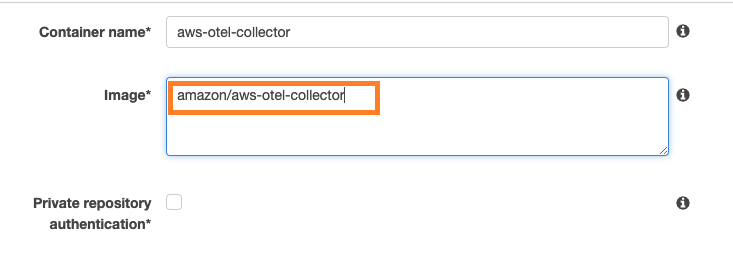
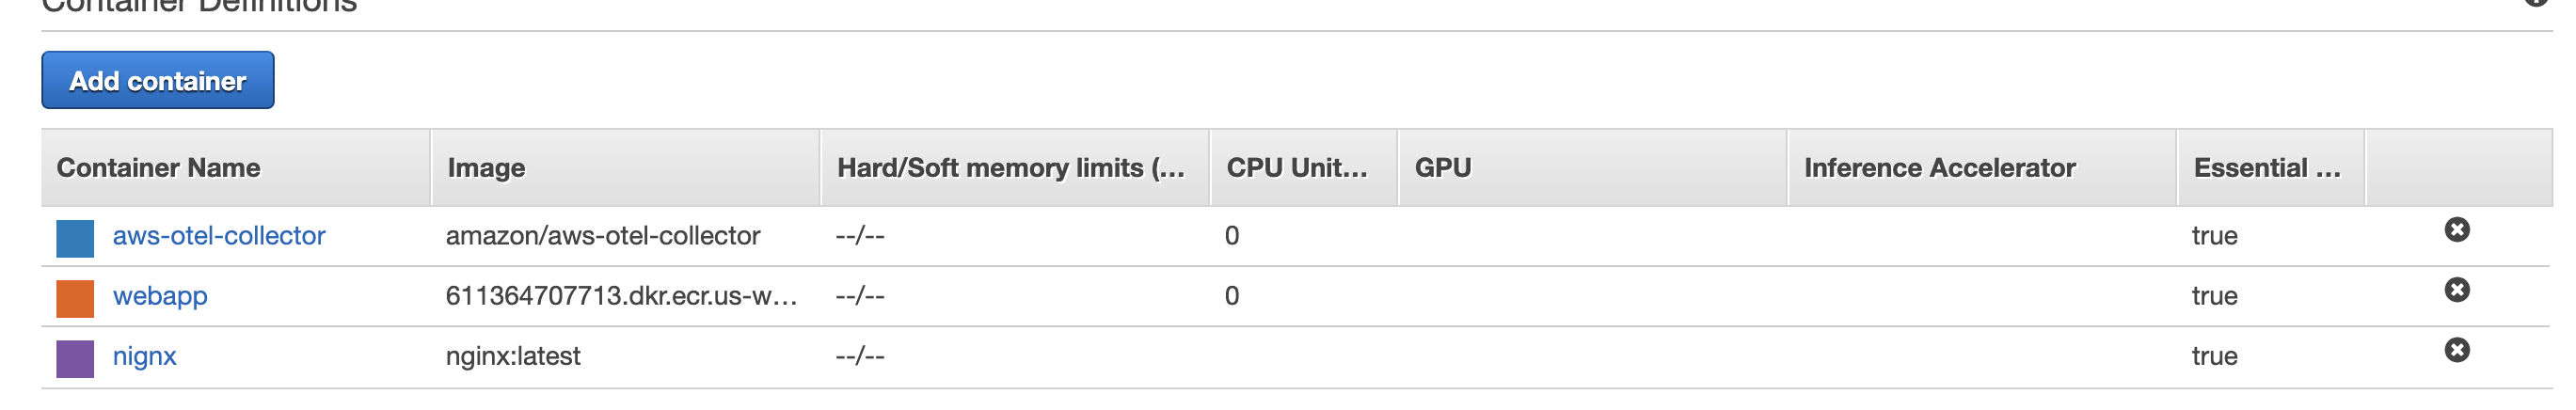
In the container definitions section, click the Add Container button. Let’s add the AWS Observability Collector container first. Put a container name (i.e. aws-otel-collector) and use the amazon/aws-otel-collector container image. We can keep everything else default
 [Optional] In the 'Advanced container configuration' section, let's setup the HealthCheck instructions for aws-otel-collector. Provide the '/healthcheck' command and enter 5s as interval, 6s as Timeout, 1s as Start period, and 5 as Retries.
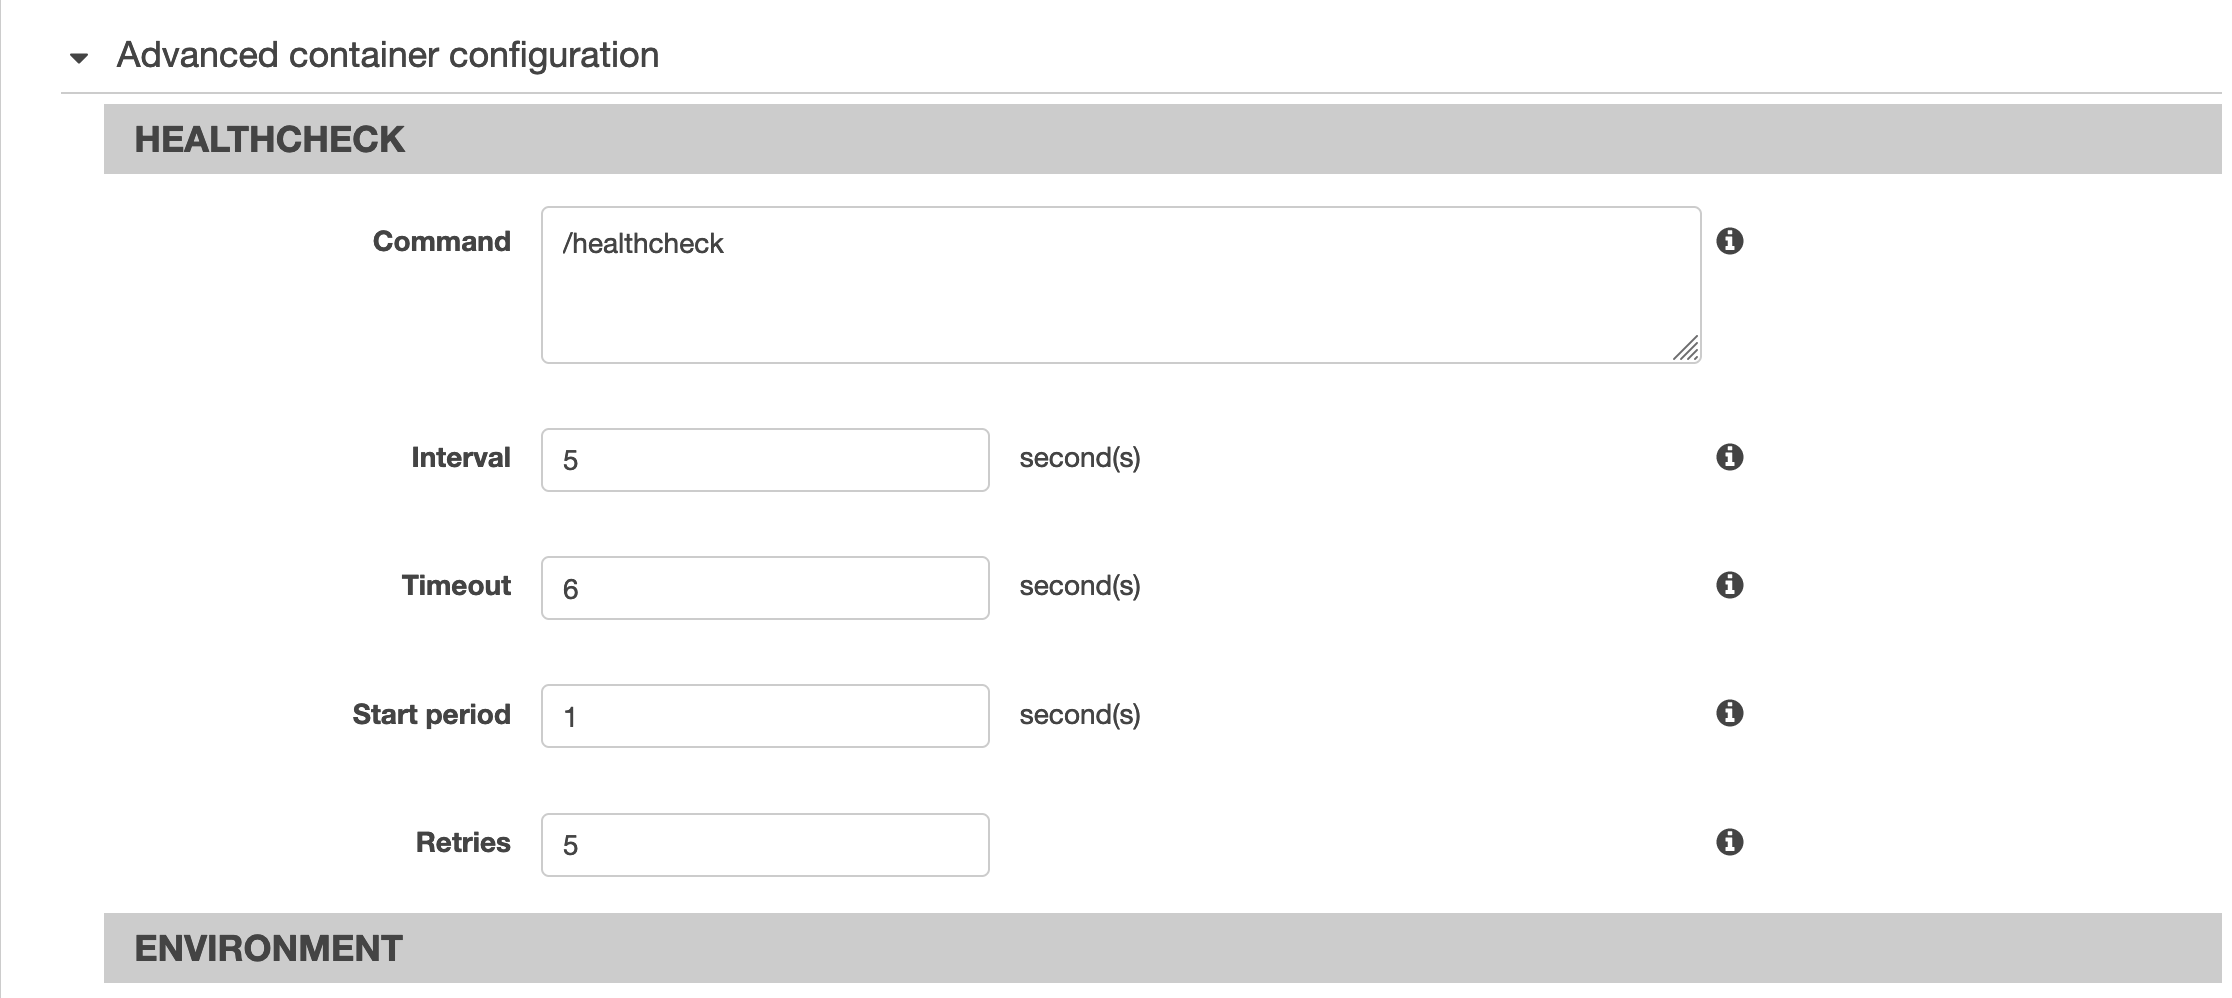
Set up the OpenTelemetry configuration file for AWS Observability Toolkit (AOT) In this section we will set the OpenTelemetry configuration file for our Collector container (ADOT Collector). All the functionality of AOC is passive, if your application doesn’t emit the data to the port (X-ray use UDP 2000, OTLP use TCP 4317 and 4318, StatsD use UDP 8125) then there will be no effect.
Collect Application Metrics and Traces:
In the Environment Command section add
--config=/etc/ecs/ecs-default-config.yamlto select the ECS default configuration file for AWS Observability Collector (AOC). This will collect Application Metrics and Traces and send them to Amazon CloudWatch Metrics and AWS X-Ray. Specifically, this configuration file can collect metrics and traces from the OpenTelemetry SDKs (OTLP), X-Ray traces from the X-Ray SDKs and StatsD metrics from your app.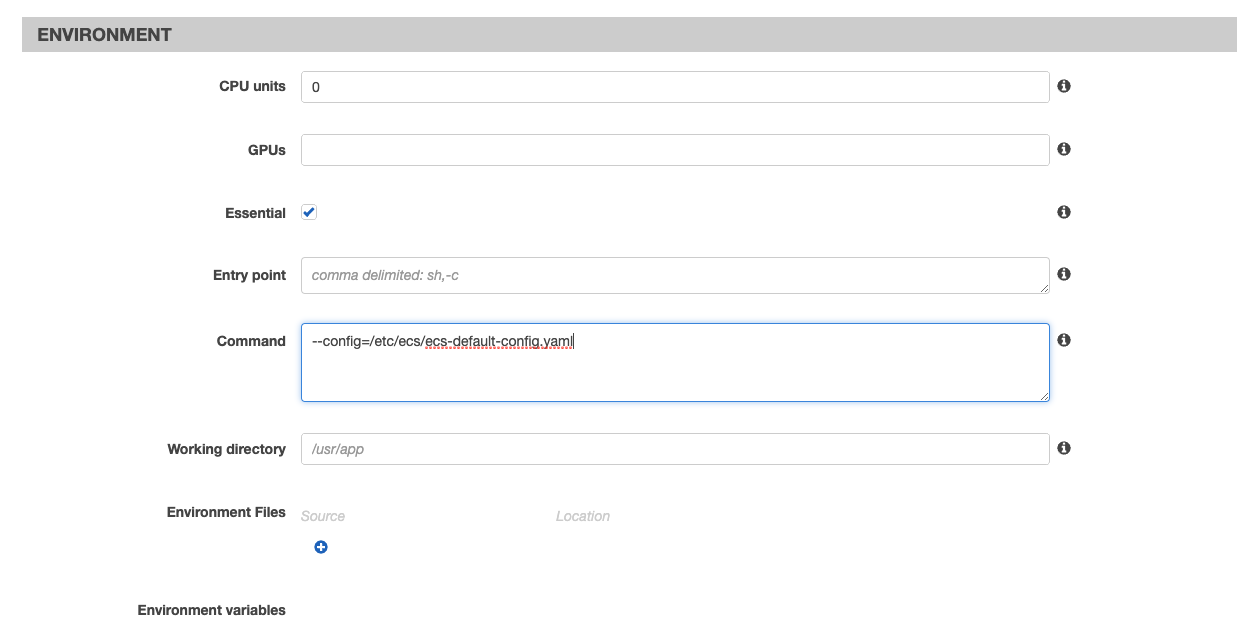
Collect Application Metrics & Traces and Container Resource Metrics
In the container definition section for Environment Command section add
--config=/etc/ecs/container-insights/otel-task-metrics-config.yaml, which is already included as part of ADOT collector, select the ECS default configuration for Container Insights experience. This will collect Application Metrics, Traces and task-level Container Resource Metrics, and send them to Amazon CloudWatch Metrics and AWS X-Ray. This configuration file can collect metrics and traces from the OpenTelemetry SDKs (OTLP) , X-Ray traces from the X-Ray SDKs and StatsD metrics from your app.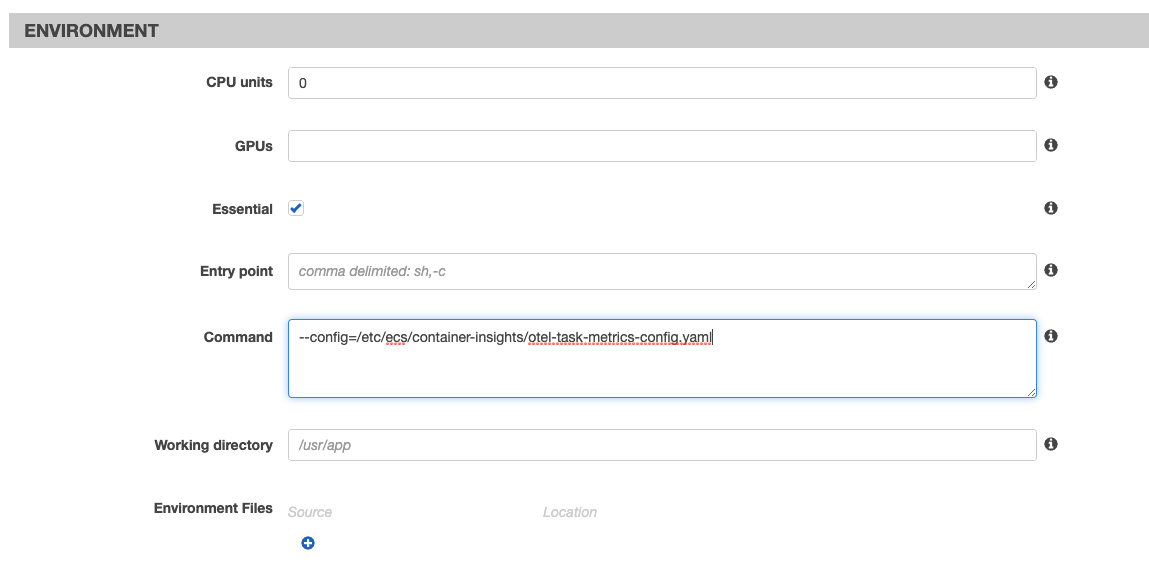
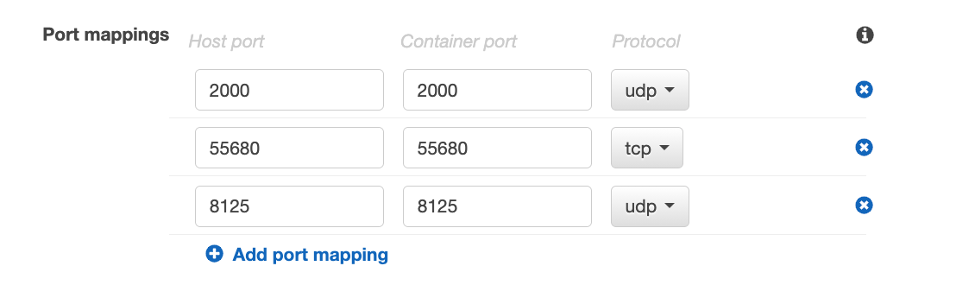
Port mapping setup
Note: For ECS Fargate launch type (slected in step 2), you can just skip this step.
For ECS EC2 launch type, add port mappings, map 2000 for udp (used by AWS X-ray for traces), 4317 for tcp (used by the collector) and 8125 for udp (used by StatsD).
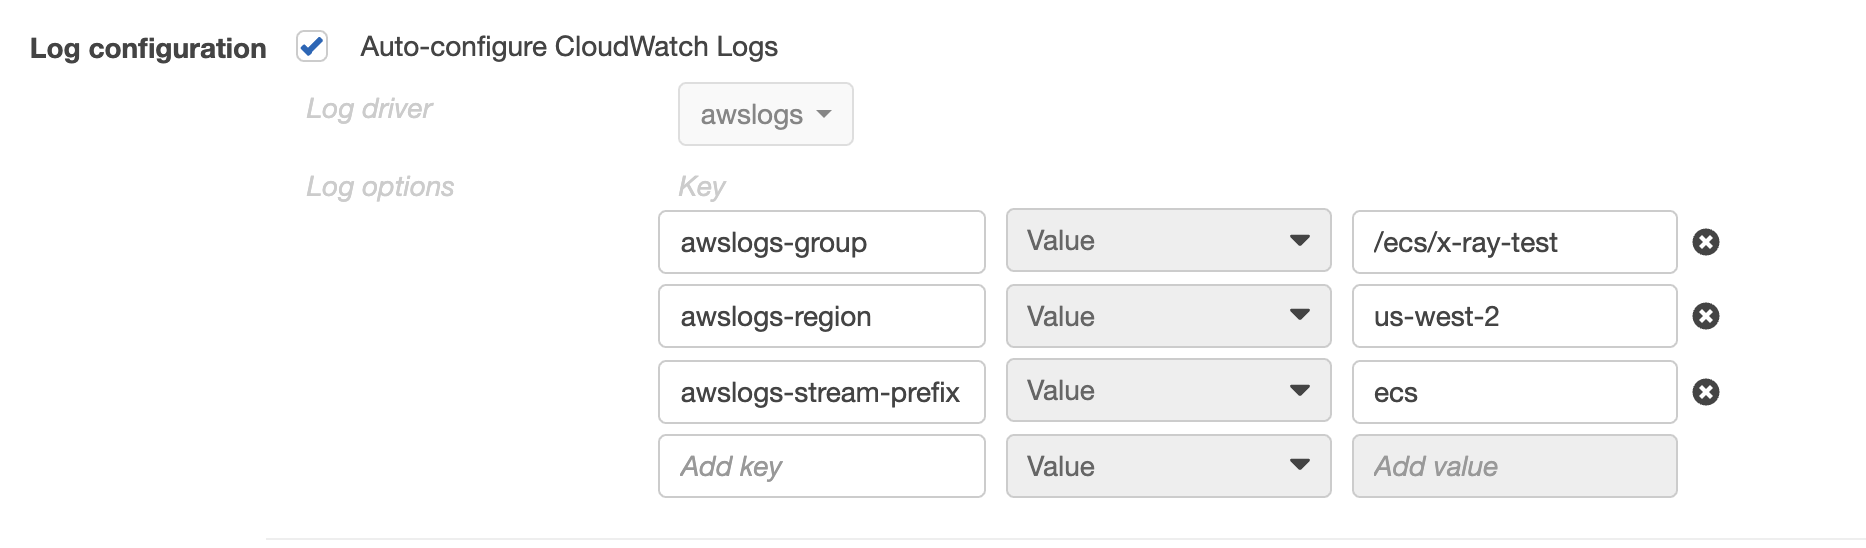
In the STORAGE and LOGGING section, let’s enable Auto-configure CloudWatch logs.
 We are done here. Keep other config options as they are. Finish adding the container.
Attention: 10, 11 and 12 will add three example applications to show how everything works. Normally, these images should be your business applications. Feel free to skip these steps.
- Let’s add a sample application container in similar way (you can configure your application like this)
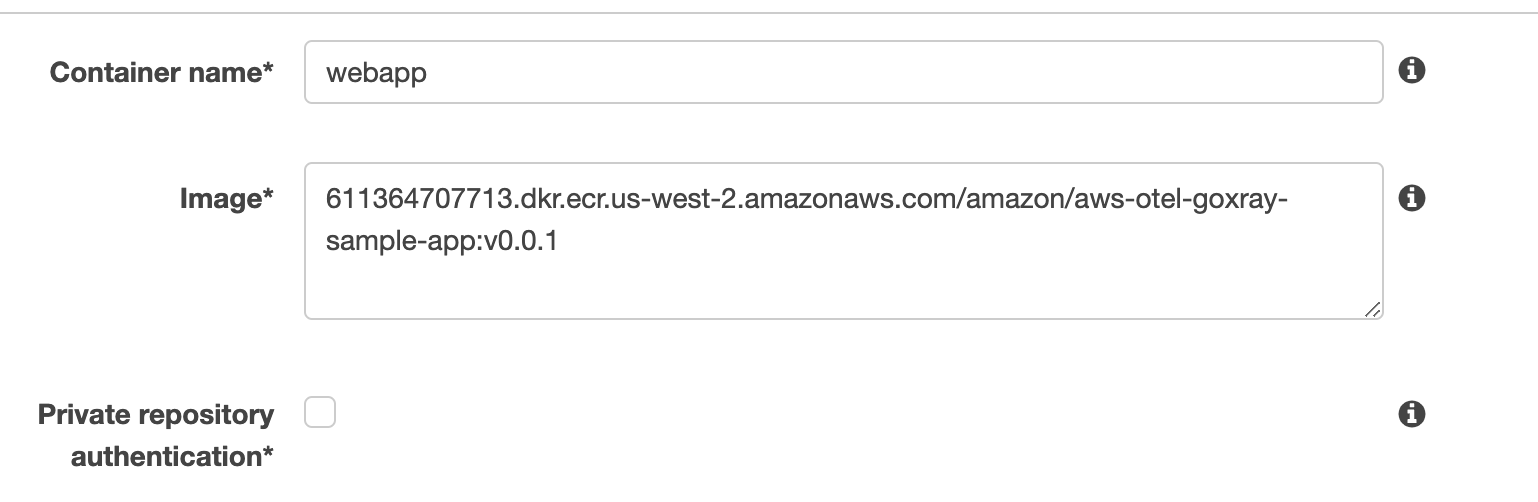
- 10.1 You can select the container name you want (i.e. webapp ), but we use another image
(Image: 611364707713.dkr.ecr.us-west-2.amazonaws.com/amazon/aws-otel-goxray-sample-app:v0.0.1). This image will
create a sample web application using Xray SDK to generate the trace data and send it to AWS Observability Collector (AOC).
- 10.2 In the STARTUP DEPENDENCY ORDERING select the Container name aws-otel-collector you used in step 6 and in the Condition, select START.

- 10.3 If you selected FARGATE as your launch Type in step 2, you can just skip this step. If you are using ECS EC2, do the following:
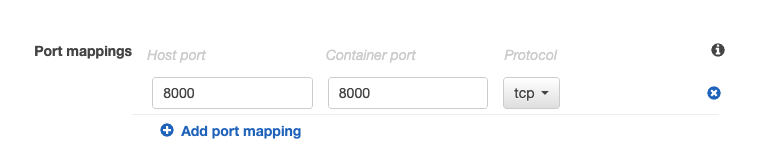
- Add Port mappings, map port 8000 for tcp.
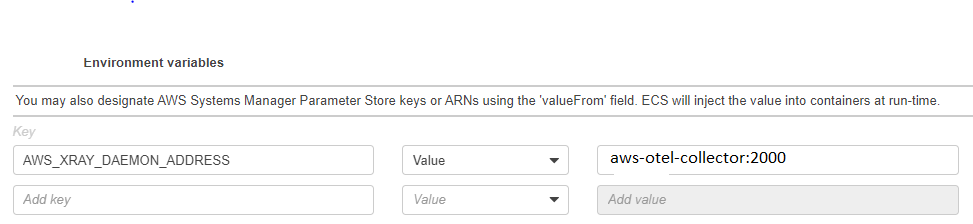
- In Environment Section, add Environment variable: AWS_XRAY_DAEMON_ADDRESS with aws-otel-collector:2000
- In the NETWORK SETTINGS Links, put the container name aws-otel-collector you used in step 6 as ADOT collector.
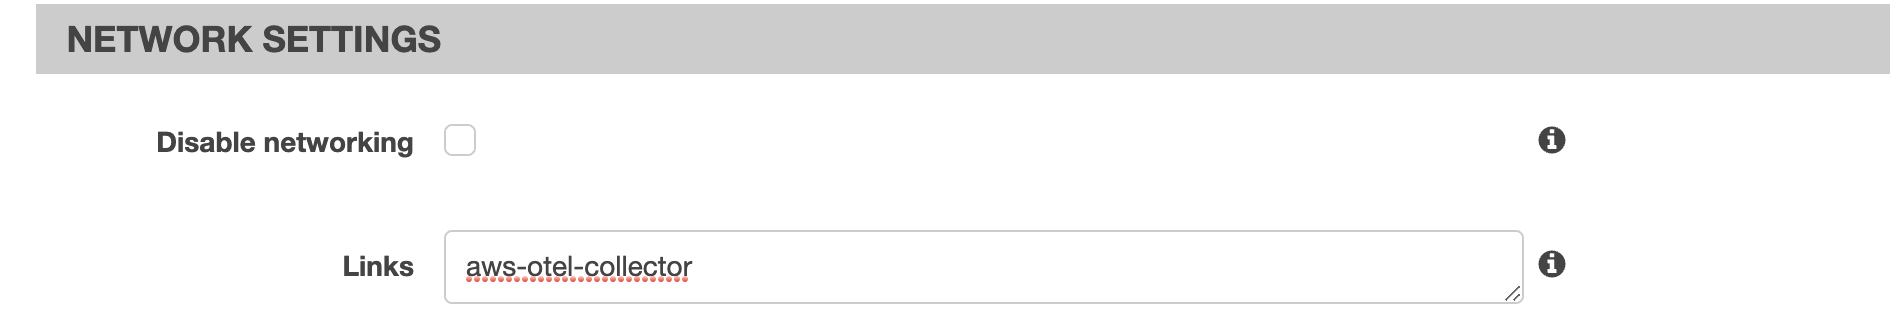
- Keep the rest information as default and click add.
- Add Port mappings, map port 8000 for tcp.
- 10.1 You can select the container name you want (i.e. webapp ), but we use another image
(Image: 611364707713.dkr.ecr.us-west-2.amazonaws.com/amazon/aws-otel-goxray-sample-app:v0.0.1). This image will
create a sample web application using Xray SDK to generate the trace data and send it to AWS Observability Collector (AOC).
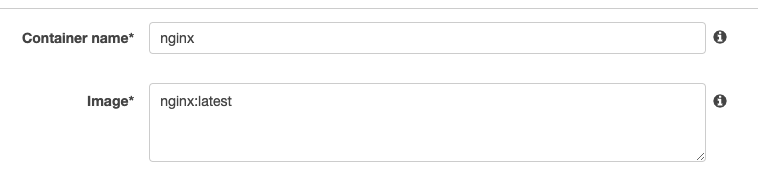
- Let’s add another application container in similar way.
- For this example, we use the nginx (Image: nginx:latest).
- In the STARTUP DEPENDENCY ORDERING select the Container name aws-otel-collector you used in step 6 and in the Condition, select START.
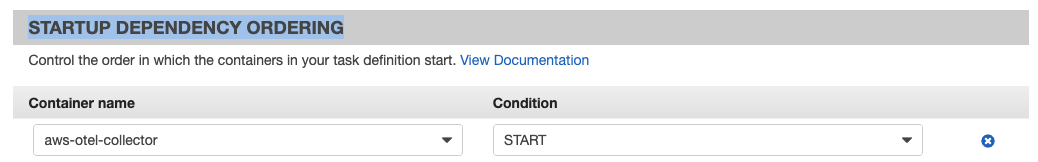
- Keep the rest information as default and click add.
- For this example, we use the nginx (Image: nginx:latest).
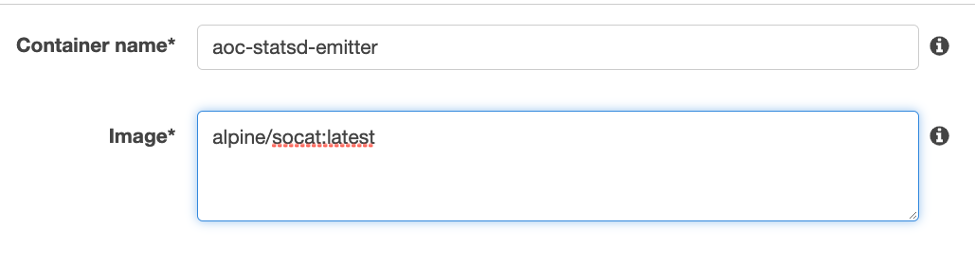
- Let's add another application to send StatsD metrics (you can change this app with yours and send to port 8125).
- For this example, we use this alpine/socat:latest (Image: alpine/socat:latest).
- Add this part to
Entry pointinENVIRONMENTto send some StatsD metrics:/bin/sh,-c,while true; do echo 'statsdTestMetric:1|c' | socat -v -t 0 - UDP:127.0.0.1:8125; sleep 1; doneHere is the output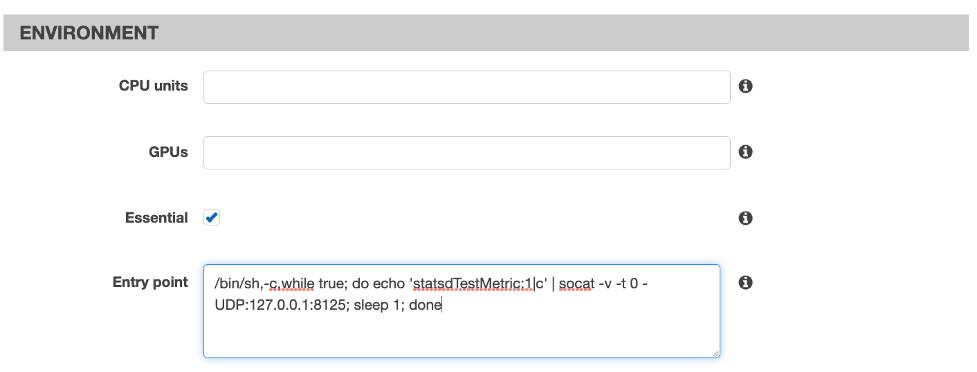
- In the STARTUP DEPENDENCY ORDERING select the Container name aws-otel-collector you used in step 6 and in the Condition, select START.
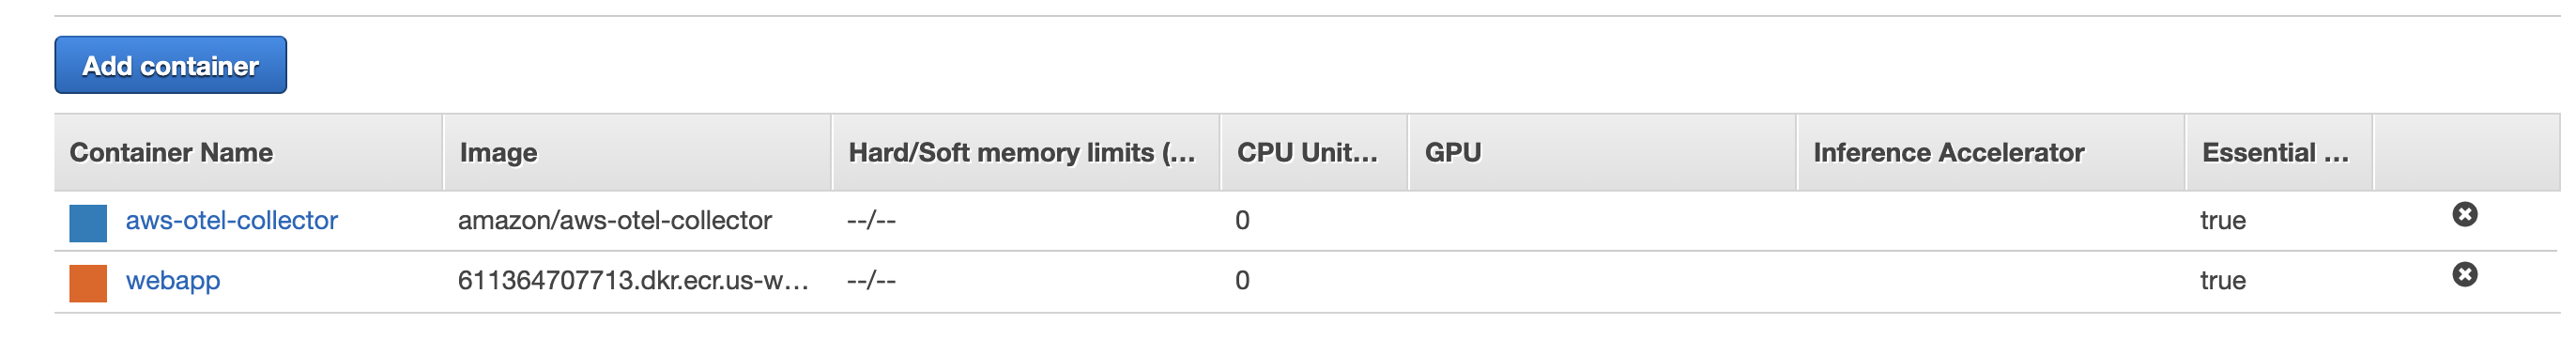
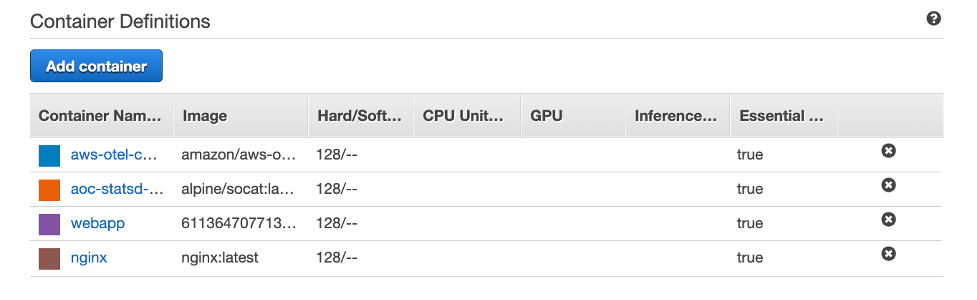
- Keep the rest information as default and click add. Now you can see four containers
- For this example, we use this alpine/socat:latest (Image: alpine/socat:latest).
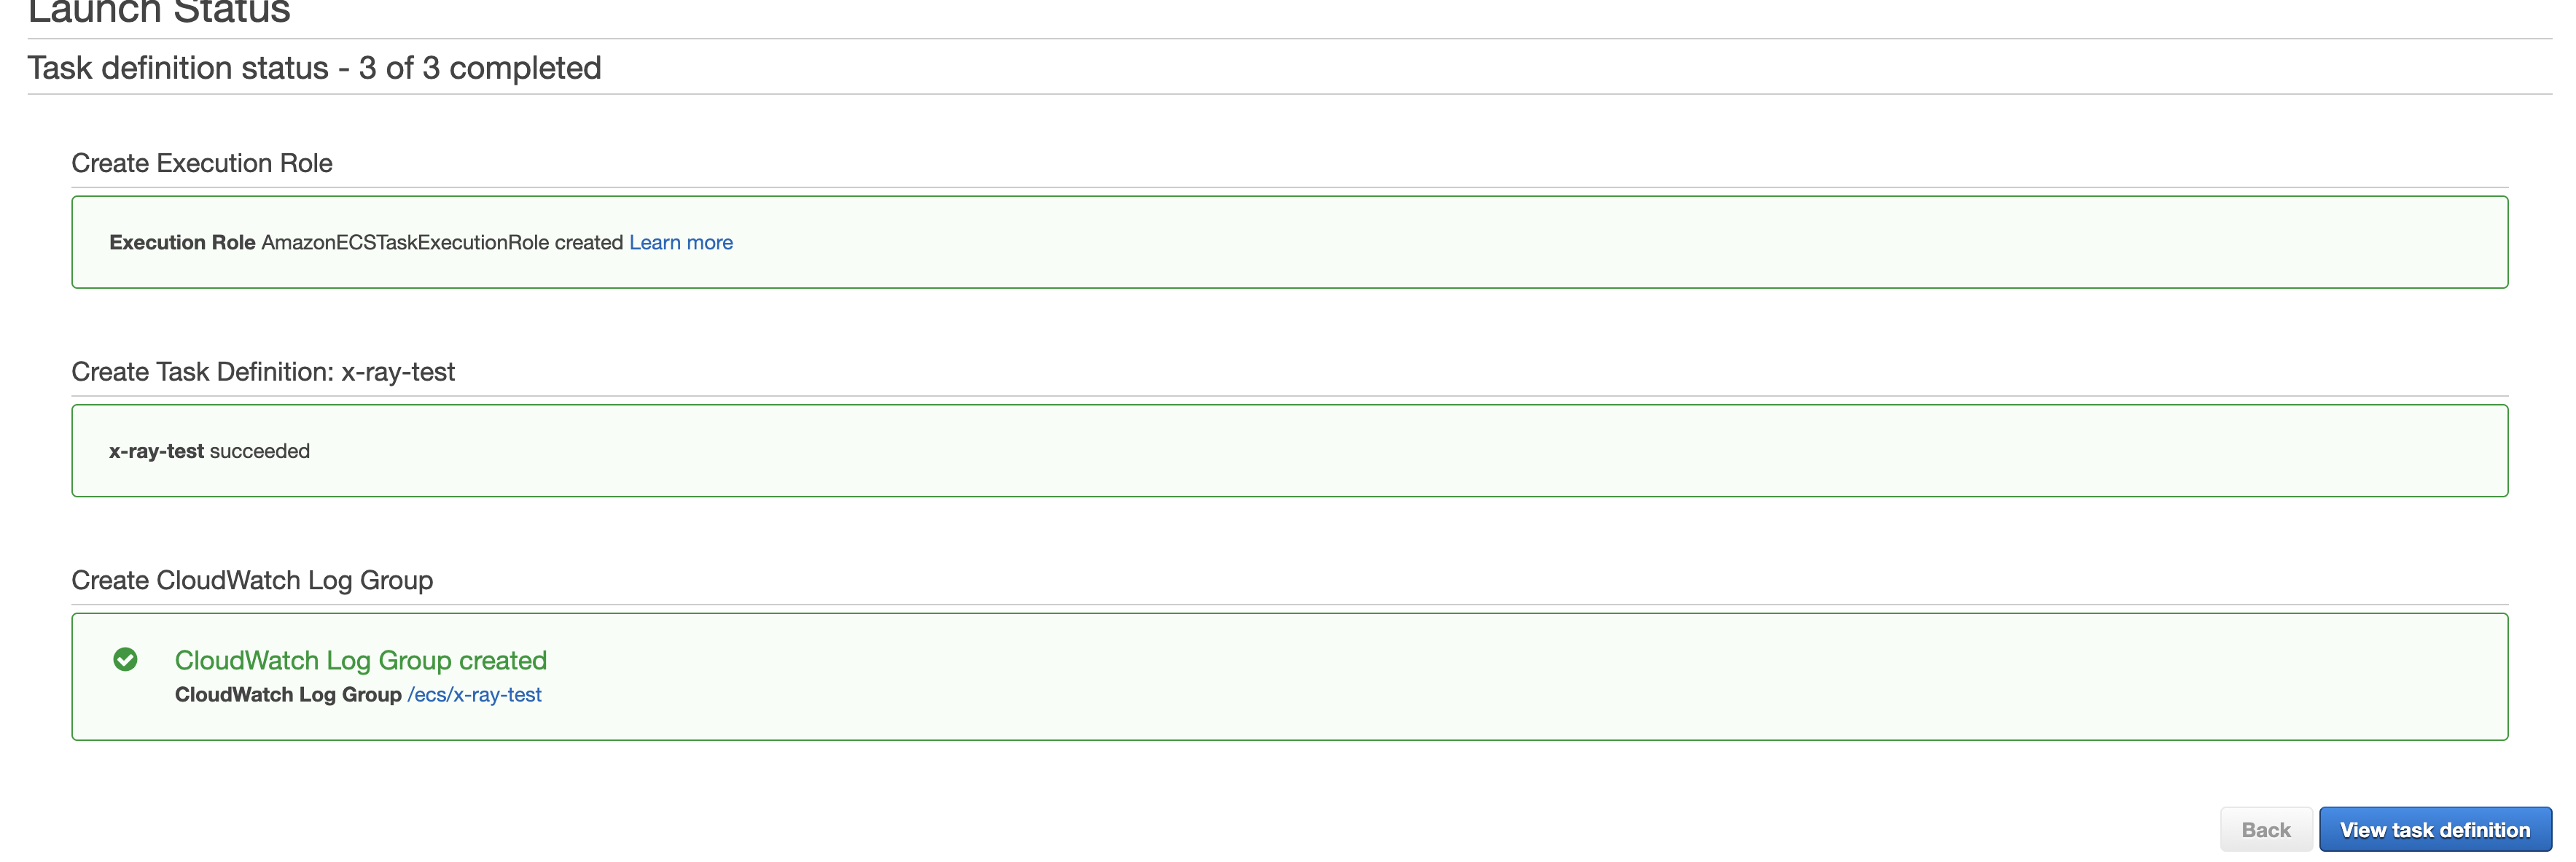
- Click the Create button in the bottom to finish the process. If everything works fine, you will see something like the following.