AWS Distro for OpenTelemetry
Results: Check StatsD metrics in Amazon CloudWatch
Results: Check StatsD metrics in Amazon CloudWatch
In this section, we will check the metrics in Amazon CloudWatch collected using statsD receiver.
- Check CloudWatch Logs
Let’s go to CloudWatch console and select Log groups from the left side navigation. Search for our log group
name /aws/ecs/application/metrics and then click the log stream name which defined before.
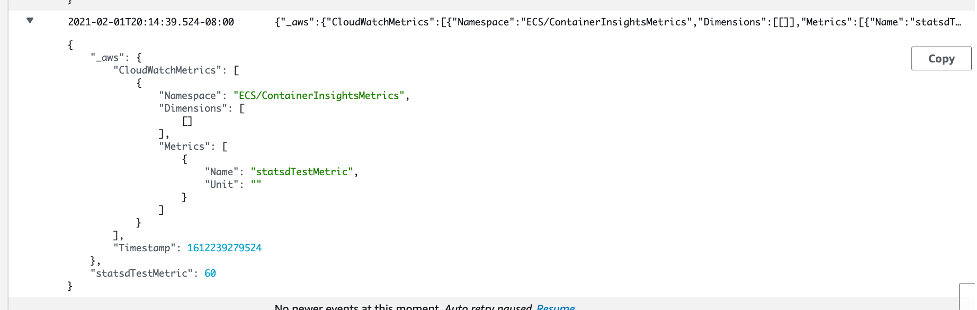
We should see our expected (following) metrics. These logs use the CloudWatch Embedded Metric
Format (EMF)
to generate CloudWatch Metrics. We sent statsdTestMetric:1|c once a second and the aggregation time is 60s, we should see the value
around to 60
Following is an example for received logs in the CloudWatch console.
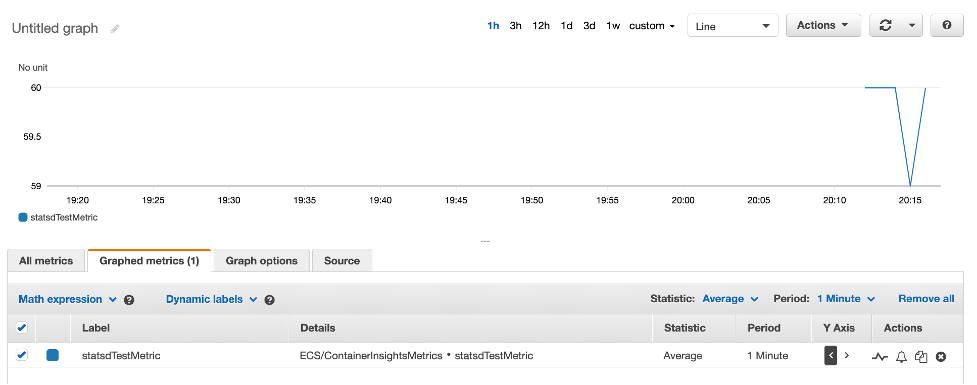
- Check CloudWatch metrics
In the CloudWatch Console, from the left side panel, select Metrics. You should be able to see ECS/AWSOTel/Application namespace. Click it and you will see the expected metrics.