AWS Distro for OpenTelemetry
Tracing with the AWS Distro for OpenTelemetry JavaScript SDK and X-Ray
Tracing with the AWS Distro for OpenTelemetry JavaScript SDK and X-Ray
Introduction
The AWS Distro for OpenTelemetry (ADOT) JavaScript contains some components from the upstream OpenTelemetry Javascript SDK. This guide will go over how to configure the relevant components of the ADOT SDK to send trace data to the AWS X-Ray backend.
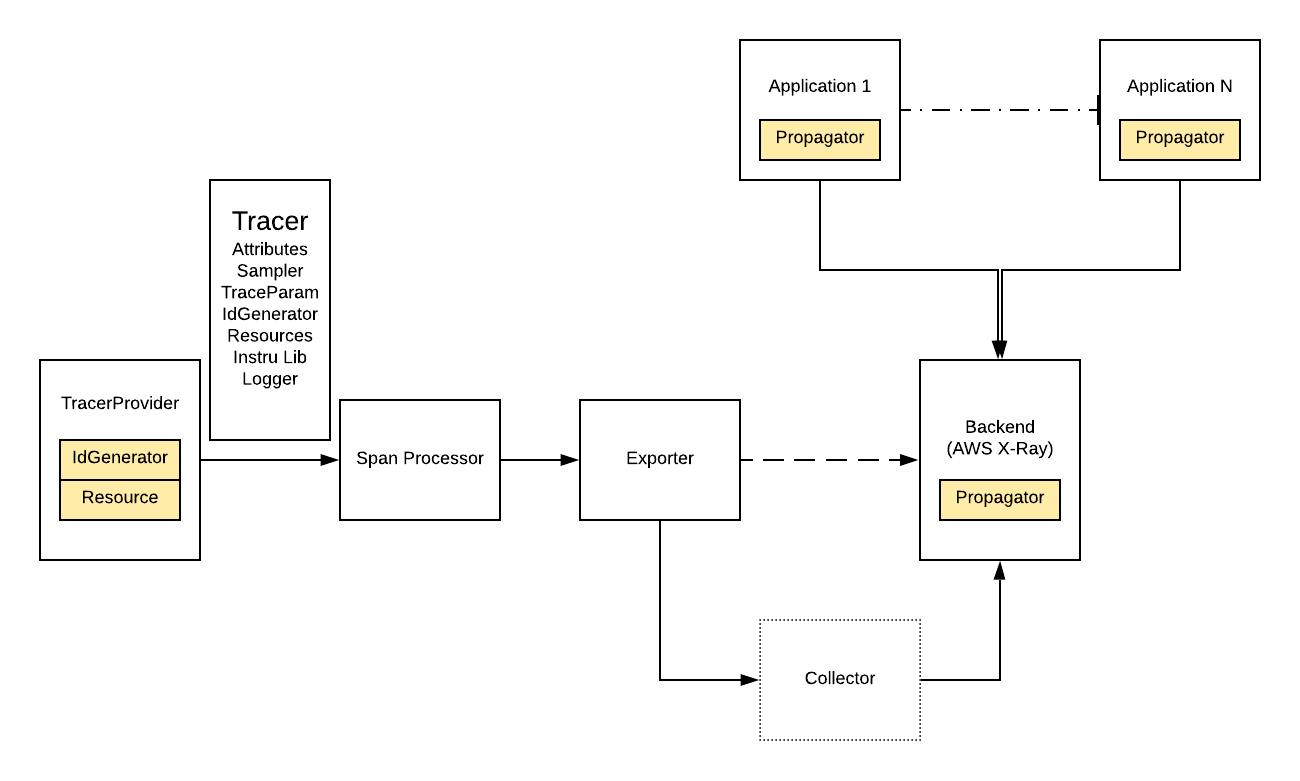
The diagram below shows the data path for exporting traces from an application instrumented with OpenTelemetry to AWS X-Ray.
Requirements
Node.js v10 (or later) is required to run an application using OpenTelemetry.
Note: You’ll also need to have the ADOT Collector running to export traces to AWS X-Ray. See the ADOT Collector documentation for setup instructions.
Installation
In order to trace your application, the following OpenTelemetry JavaScript packages must be installed in your application's main directory.
npm install --save \ @opentelemetry/api \ @opentelemetry/sdk-node \ @opentelemetry/exporter-trace-otlp-grpcInstall the AWS X-Ray components.
npm install --save \ @opentelemetry/id-generator-aws-xray \ @opentelemetry/propagator-aws-xraySetting up the Global Tracer
Sending Traces to AWS X-Ray
In order to send trace data to AWS X-Ray via the ADOT Collector, you must configure the X-Ray ID generator, X-Ray propagator, and collector gRPC exporter on the global tracer provider.
1const process = require('process');2const opentelemetry = require("@opentelemetry/sdk-node");3const { Resource } = require("@opentelemetry/resources");4const { SemanticResourceAttributes } = require("@opentelemetry/semantic-conventions");5const { BatchSpanProcessor} = require('@opentelemetry/sdk-trace-base');6const { OTLPTraceExporter } = require('@opentelemetry/exporter-trace-otlp-grpc');7const { AWSXRayPropagator } = require("@opentelemetry/propagator-aws-xray");8const { AWSXRayIdGenerator } = require("@opentelemetry/id-generator-aws-xray");9const { HttpInstrumentation } = require("@opentelemetry/instrumentation-http");10const { AwsInstrumentation } = require("@opentelemetry/instrumentation-aws-sdk");11
12const _resource = Resource.default().merge(new Resource({13 [SemanticResourceAttributes.SERVICE_NAME]: "js-sample-app",14 }));15const _traceExporter = new OTLPTraceExporter();16const _spanProcessor = new BatchSpanProcessor(_traceExporter);17const _tracerConfig = {18 idGenerator: new AWSXRayIdGenerator(),19}20
21async function nodeSDKBuilder() {22 const sdk = new opentelemetry.NodeSDK({23 textMapPropagator: new AWSXRayPropagator(),24 instrumentations: [25 new HttpInstrumentation(),26 new AwsInstrumentation({27 suppressInternalInstrumentation: true28 }),29 ],30 resource: _resource,31 spanProcessor: _spanProcessor,32 traceExporter: _traceExporter,33 });34 sdk.configureTracerProvider(_tracerConfig, _spanProcessor);35
36 // this enables the API to record telemetry37 await sdk.start();38 // gracefully shut down the SDK on process exit39 process.on('SIGTERM', () => {40 sdk.shutdown()41 .then(() => console.log('Tracing and Metrics terminated'))42 .catch((error) => console.log('Error terminating tracing and metrics', error))43 .finally(() => process.exit(0));44 });45}Using the AWS Resource Detectors
The ADOT JavaScript SDK supports automatically recording metadata in EC2, Elastic Beanstalk, ECS, and EKS environments. To install the package containing the resource detectors, run:
npm install --save @opentelemetry/resource-detector-awsYou can add one or more of the detectors to your tracerConfig:
import { detectResources } from '@opentelemetry/resources';import { awsEc2Detector } from '@opentelemetry/resource-detector-aws'const resource = await detectResources({ detectors: [awsEc2Detector],})
const tracerProvider = new NodeTracerProvider({ resource });To see what attributes are captured and how to add other resource detectors, see the OpenTelemetry documentation.
Adding support for Metrics
The API and SDK for Metrics became stable for OpenTelemetry for JavaScript. The following piece of code initialize the OpenTelemetry SDK to use Metrics and Traces.
const _resource = Resource.default().merge(new Resource({ [SemanticResourceAttributes.SERVICE_NAME]: "js-sample-app", }));const _traceExporter = new OTLPTraceExporter();const _spanProcessor = new BatchSpanProcessor(_traceExporter);const _tracerConfig = { idGenerator: new AWSXRayIdGenerator(),}const _metricReader = new PeriodicExportingMetricReader({ exporter: new OTLPMetricExporter(), exportIntervalMillis: 1000});
async function nodeSDKBuilder() { const sdk = new opentelemetry.NodeSDK({ textMapPropagator: new AWSXRayPropagator(), metricReader: _metricReader, instrumentations: [ new HttpInstrumentation(), new AwsInstrumentation({ suppressInternalInstrumentation: true }), ], resource: _resource, spanProcessor: _spanProcessor, traceExporter: _traceExporter, }); sdk.configureTracerProvider(_tracerConfig, _spanProcessor);
// this enables the API to record telemetry await sdk.start(); // gracefully shut down the SDK on process exit process.on('SIGTERM', () => { sdk.shutdown() .then(() => console.log('Tracing and Metrics terminated')) .catch((error) => console.log('Error terminating tracing and metrics', error)) .finally(() => process.exit(0)); });}Debug Logging
To enable debug logging for the OpenTelemetry SDK, configure the provided Diag logger as follows. Do this as early in your program as possible to capture all OpenTelemetry SDK behavior.
const { DiagConsoleLogger, DiagLogLevel, diag } = require('@opentelemetry/api');diag.setLogger(new DiagConsoleLogger(), DiagLogLevel.DEBUG);Instrumenting an Application
Warning: Some instrumentations are not yet stable and their configuration and the attributes they collect are subject to change until the instrumentation reaches 1.0 stability. It is recommended to pin a specific version of an instrumentation to avoid breaking changes.
OpenTelemetry can collect tracing data from various applications automatically using plugins. The plugins offer instrumenting popular frameworks such as Hapi, Express, Redis, GraphQL, and many more. The full list of supported libraries and installation instructions can be found on the OpenTelemetry JavaScript Contrib repo.
Instrumenting the AWS SDK
Tracing support for downstream AWS SDK calls to Amazon DynamoDB, S3, and others is provided by the OpenTelemetry AWS SDK Instrumentation.
Install the following dependency with npm:
npm install --save @opentelemetry/instrumentation-aws-sdkThen register the AWS SDK instrumentation as follows:
1const { AwsInstrumentation } = require('@opentelemetry/instrumentation-aws-sdk');2
3const sdk = new opentelemetry.NodeSDK({4 instrumentations: [5 new AwsInstrumentation({6 suppressInternalInstrumentation: true7 }),8 ],9 resource: _resource,10 spanProcessor: _spanProcessor,11 traceExporter: _traceExporter,12 });Custom Instrumentation
Creating Custom Spans
You can use custom spans to monitor the performance of internal activities that are not captured by instrumentation libraries.
Note that only spans of kind Server are converted into X-Ray segments, all other spans are converted into X-Ray subsegments.
For more on segments and subsegments, see the AWS X-Ray developer guide.
const { SpanKind } = require("@opentelemetry/api")
const serverSpan = tracer.startActiveSpan('server', { kind: SpanKind.SERVER }); // This span will appear as a segment in X-Rayconst internalSpan = tracer.startActiveSpan('operation', { kind: SpanKind.INTERNAL }); // This span will appear as a subsegment in X-Ray//...internalSpan.end();serverSpan.end();Adding Custom Attributes
You can also add custom key-value pairs as attributes onto your spans. Attributes are converted to metadata by default. If you configure your collector, you can convert some or all of the attributes to annotations. To read more about X-Ray annotations and metadata see the AWS X-Ray Developer Guide.
const span = tracer.startActiveSpan('sample');span.setAttribute('key', 'value');span.end();Creating Metrics
Similarly to Traces, you can create custom metrics in your application using the OpenTelemetry API and SDK. Refer to Metric-Manual-Instrumentation for introduction to metric creation using OpenTelemetry JavaScript SDK.
Sample Application
See the AWS Distro for OpenTelemetry Sample Code with JavaScript SDK for instructions on setting up and using the sample app.